Analytical Systems: Warehouses, Hadoop, and the Lakehouse

Every database we've covered so far has one job: running an application. They store orders as they're placed, serve profiles as they're viewed, accept writes as they happen. This is the live, operational heartbeat of a product, and it's called OLTP, online transaction processing.
But there's a completely different kind of data work, and it's the subject of this deep-dive. It's the work of understanding the business rather than running it: "what were our sales by region over the last three years?", "which features do our most valuable users have in common?", "is this metric trending up or down?" This is OLAP, online analytical processing, and it's so different from operational work that it gets its own entire category of systems: data warehouses, the big-data tools that grew from Hadoop, and the modern lakehouse. This is the analytics branch of the evolution story, and it's where a huge amount of a company's real decision-making power lives.
Two opposite jobs
The reason analytics needs its own systems comes down to a fundamental mismatch. Operational and analytical work pull in opposite directions.
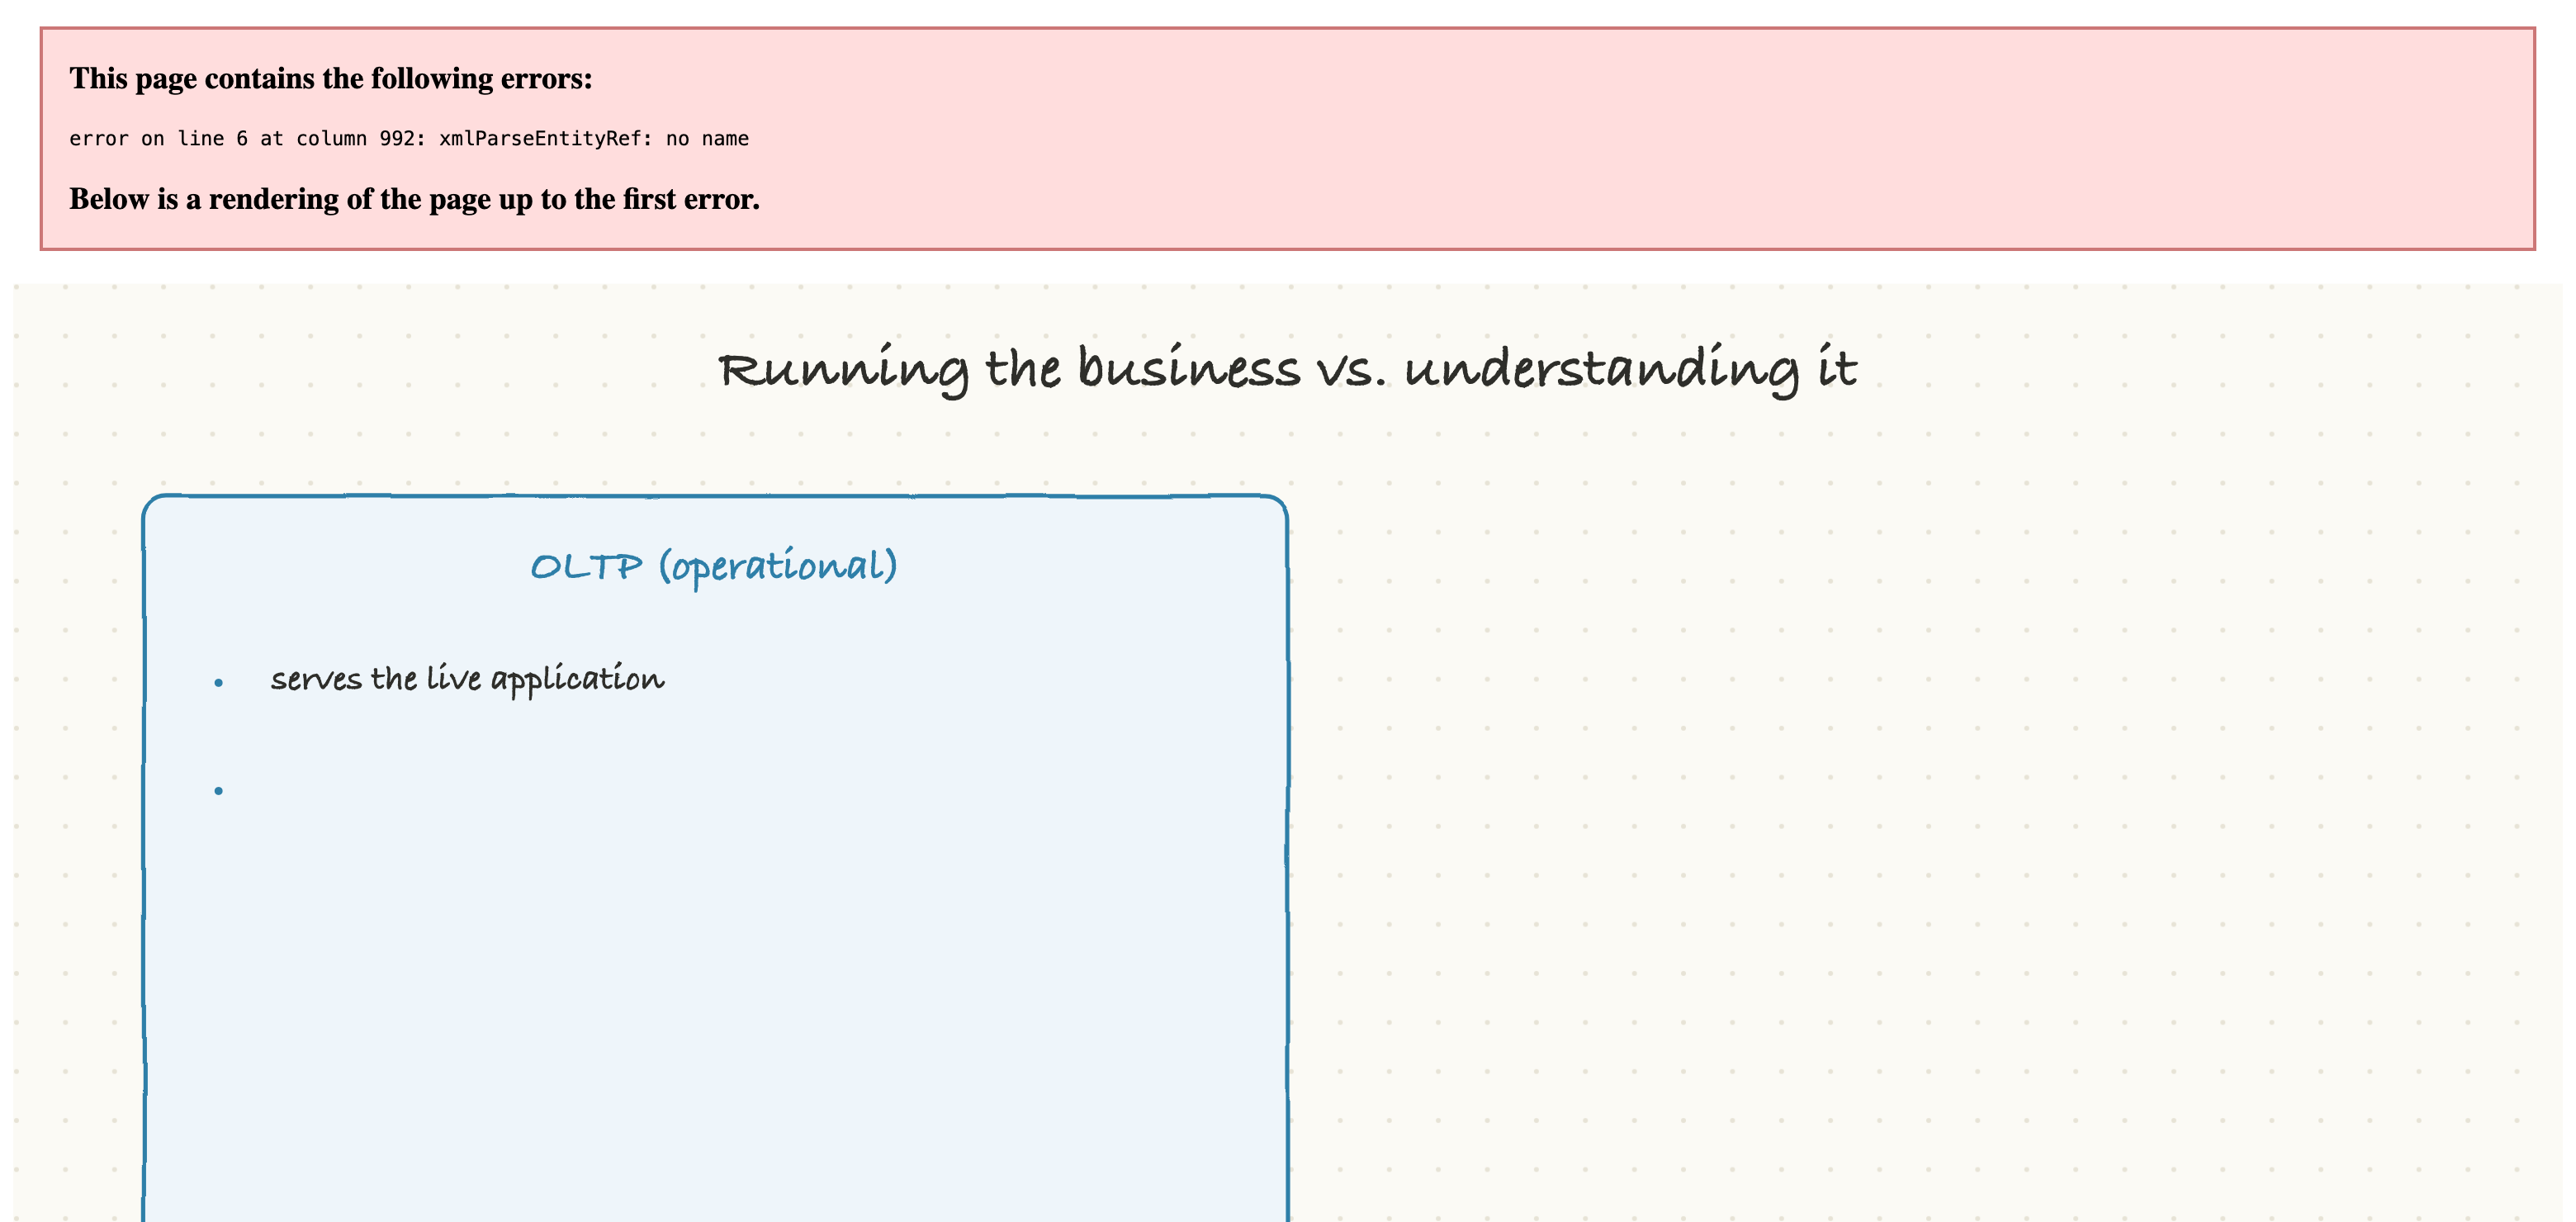
Operational (OLTP) work is many tiny operations: add this order, update this user, each touching a row or two, needed instantly, serving the live app. Analytical (OLAP) work is the opposite: a few enormous queries that scan across millions or billions of rows to compute sums, averages, and trends, serving analysts, dashboards, and machine-learning models. One is a hummingbird taking a thousand tiny sips; the other is an elephant taking a few enormous gulps.
These reward genuinely opposite designs, which is why analytical data almost always lives in a separate system, with data copied over from the operational databases on a schedule. This separation also protects the live application, a point we'll return to, because you really don't want a giant analytical query competing with real customers for the operational database.
Why analytics stores data by column
The single most important technical idea in analytics is how the data is physically laid out on disk. Operational databases store data row by row, because they grab whole records. Analytical systems flip this and store data column by column, and understanding why unlocks the whole field.
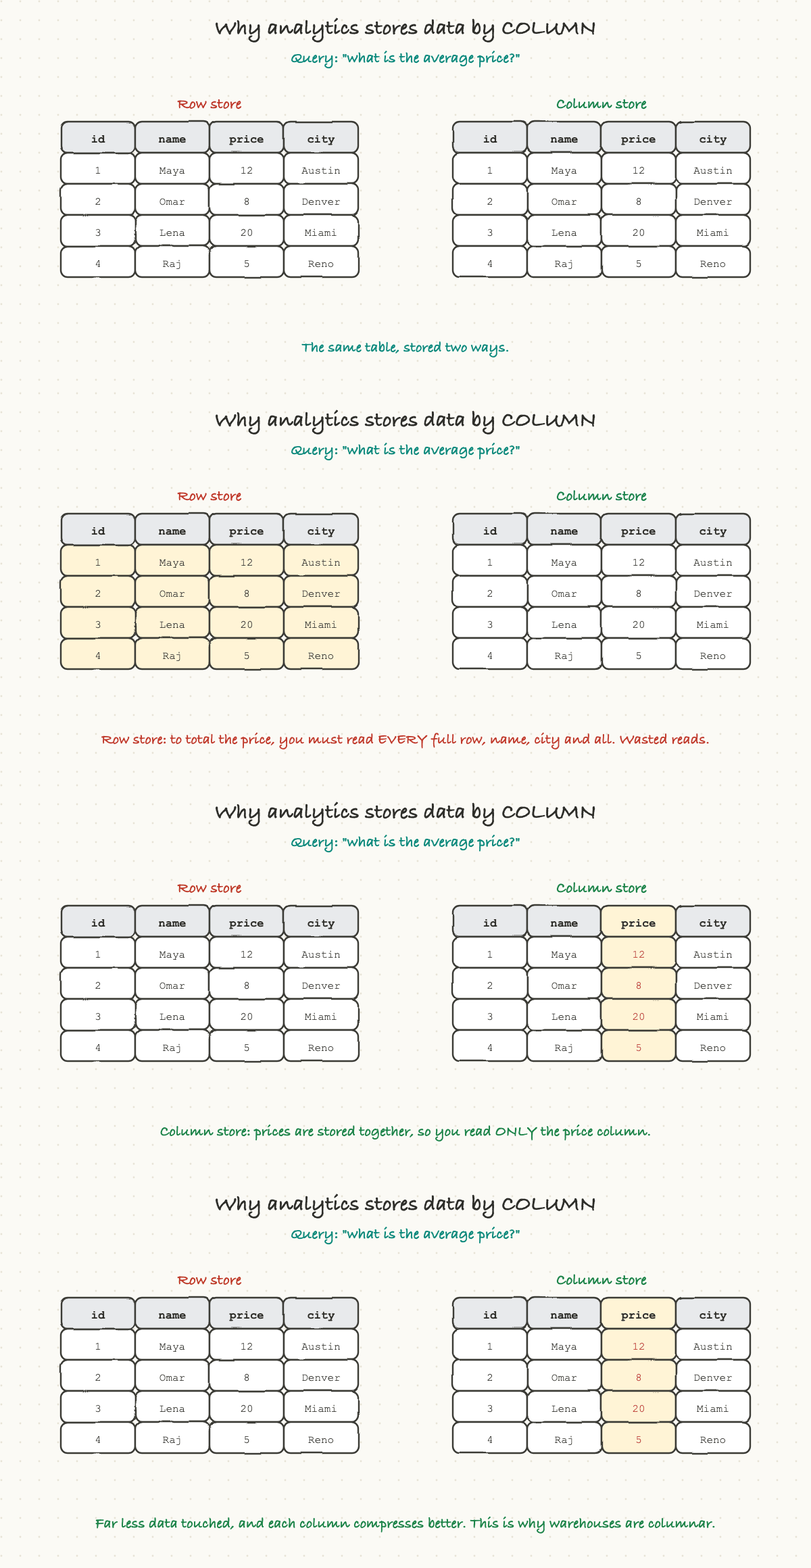
Picture the query "what is the average price?" across a billion-row table. In a row store, the prices are scattered, one inside each row, interleaved with names, cities, and everything else. To total them, the system has to read every full row and pick out the price, dragging along mountains of data it doesn't need. In a columnar store, all the prices are stored together in one place, so the system reads just the price column and ignores the rest entirely.
For analytical queries, which typically touch a few columns across vast numbers of rows, this is a massive win, often reading a small fraction of the data. And there's a bonus: because a column holds values of the same type (all prices, all dates), it compresses far better than mixed-up rows, saving storage and making scans even faster. This columnar layout, used by formats like Parquet and by every serious data warehouse, is the foundation that makes analytics at scale practical.
The big-data era: split, process, combine
In the 2000s, data outgrew what any single machine could store or process, and a new approach was needed. The breakthrough idea, which became Hadoop, was beautifully simple: if the data is too big for one computer, spread it across hundreds of cheap ones and bring the computation to the data. The processing model that made this work was called MapReduce.
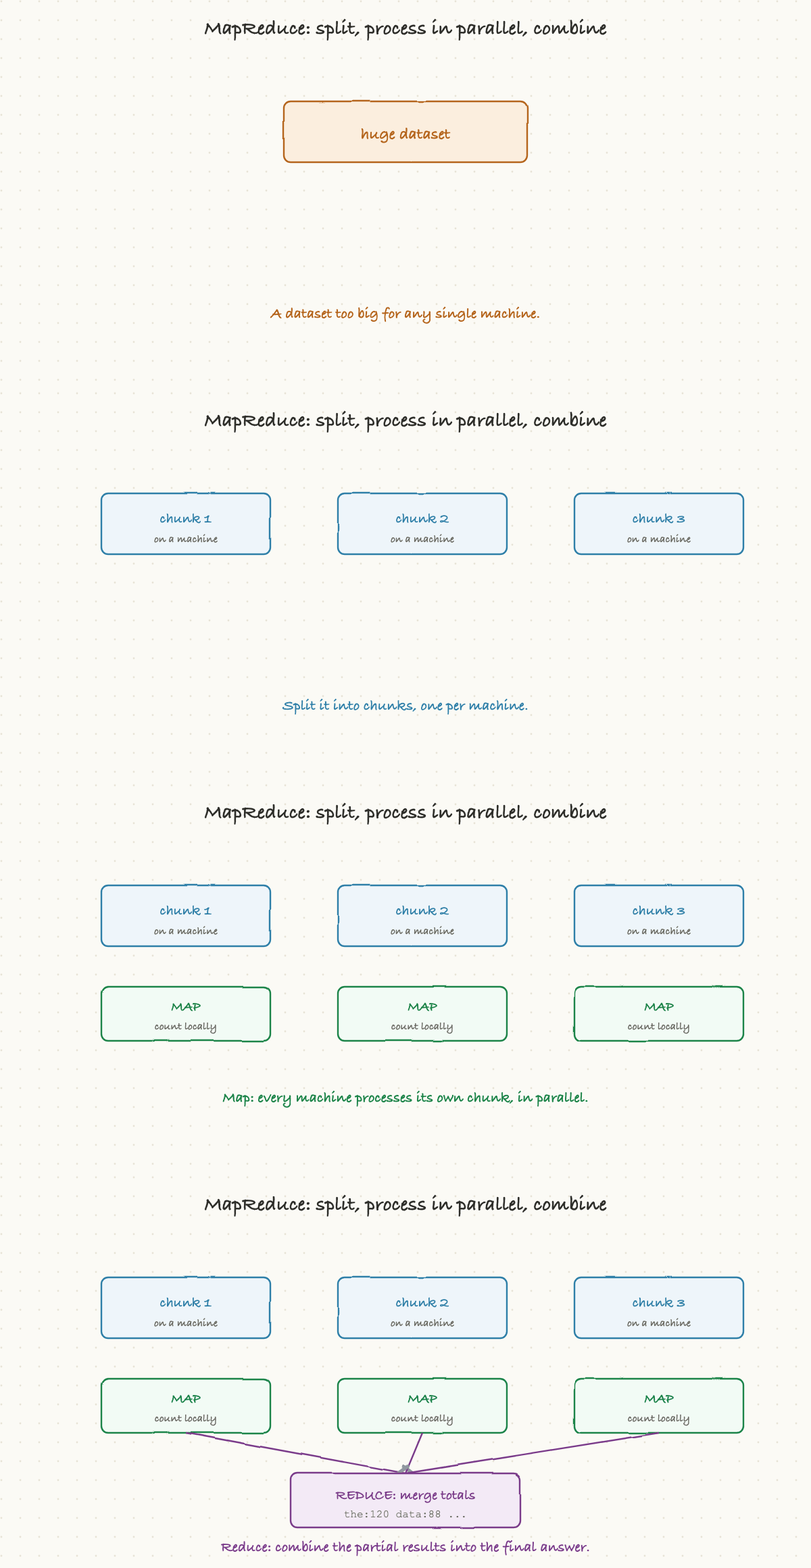
The pattern is the whole idea. Take a job too big for one machine, like counting word frequencies across the entire internet. Split the data into chunks, one per machine. Map: every machine processes its own chunk independently and in parallel, producing partial results. Reduce: combine all those partial results into the final answer. Split, process in parallel, combine. That simple pattern let companies process amounts of data that were previously unthinkable, using racks of ordinary servers instead of one impossibly large computer.
MapReduce was powerful but clunky and slow to write for. Its spiritual successor, Spark, kept the same split-process-combine philosophy but made it far faster (by working in memory) and far easier to use. Today, when engineers talk about large-scale data processing, they usually mean Spark or something like it, but it's all built on that same foundational insight: parallelize across many machines and combine the results.
Warehouse, lake, and lakehouse
As analytics matured, two different philosophies emerged for where to put all this data, and then a third that merged them.
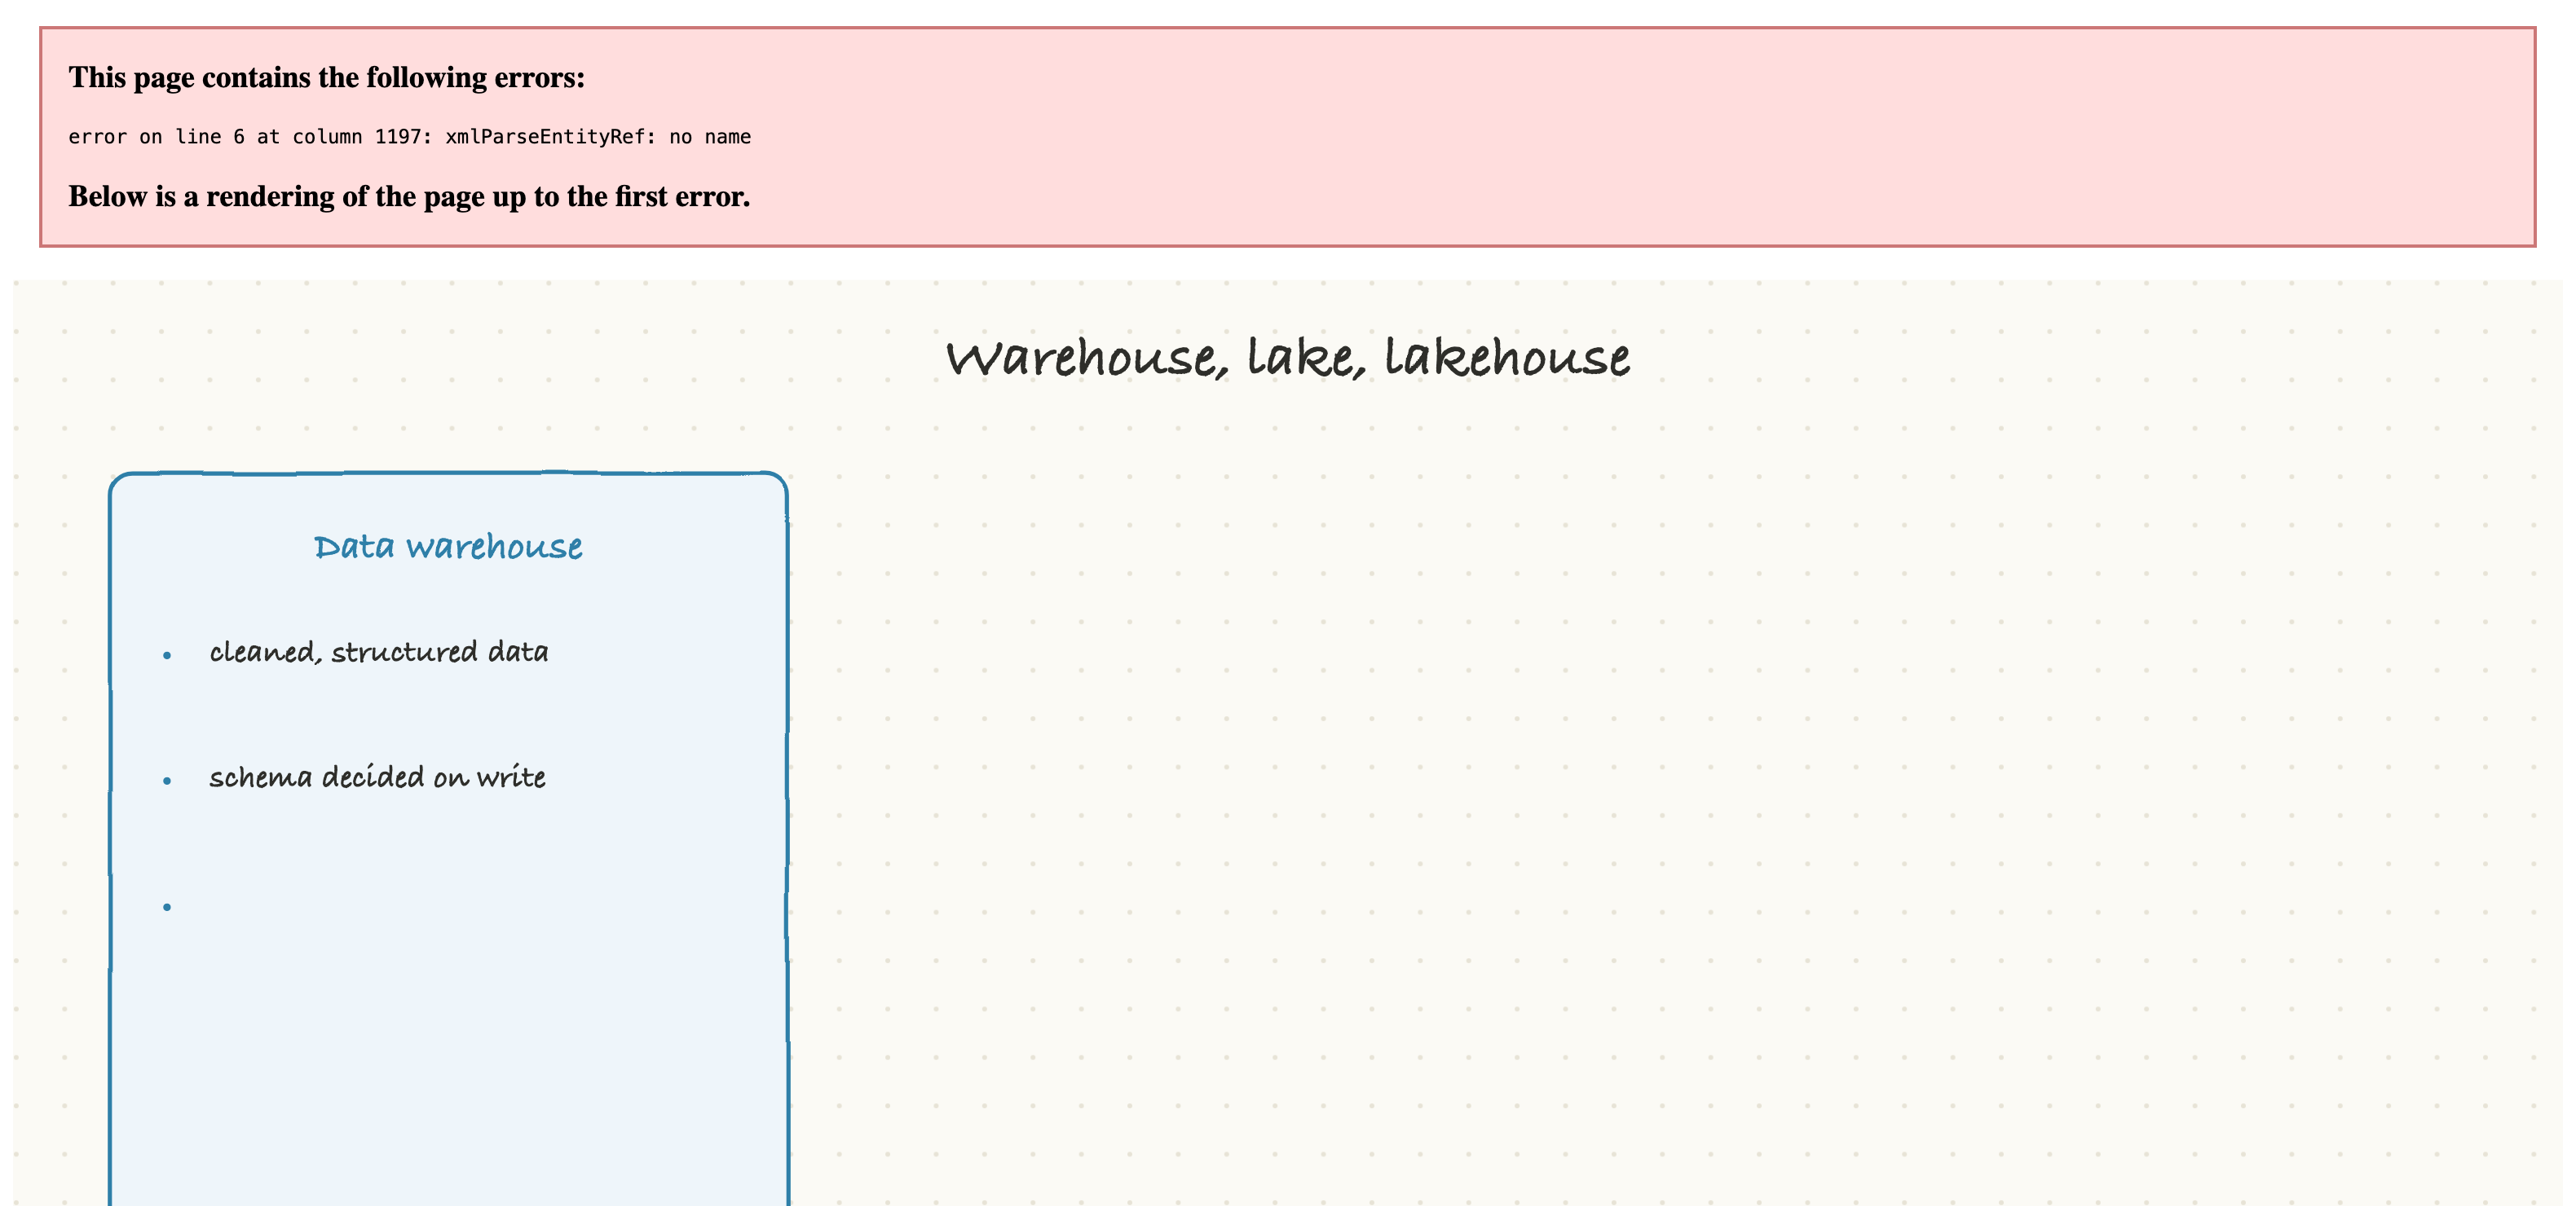
A data warehouse stores clean, structured, organized data, with the schema decided up front, optimized for fast SQL queries and dashboards. It's polished and quick but pricier, and you have to shape the data before it goes in. BigQuery, Redshift, and Snowflake are the big names. A data lake takes the opposite approach: dump in all your raw data in any format, cheaply, and figure out the structure later when you read it. It's flexible and inexpensive (just cheap object storage holding files), but without discipline it can become a "data swamp" that's hard to use.
For years teams painfully ran both: a lake for cheap raw storage and a warehouse for fast queries, with data copied between them. The lakehouse is the modern convergence that ends that split. It puts a layer of structure, transactions, and management (technologies like Delta Lake and Apache Iceberg) directly on top of cheap lake storage, giving you a warehouse's speed and reliability with a lake's low cost and flexibility, in one place. For most new analytics work, the lakehouse is becoming the default answer.
When do you clean the data: ETL vs. ELT
One more concept comes up constantly, and it's a small acronym swap with a big meaning. Getting data from the operational world into the analytical world involves three steps: Extract it from the source, Transform it (clean and reshape it), and Load it into the destination. The question is the order.
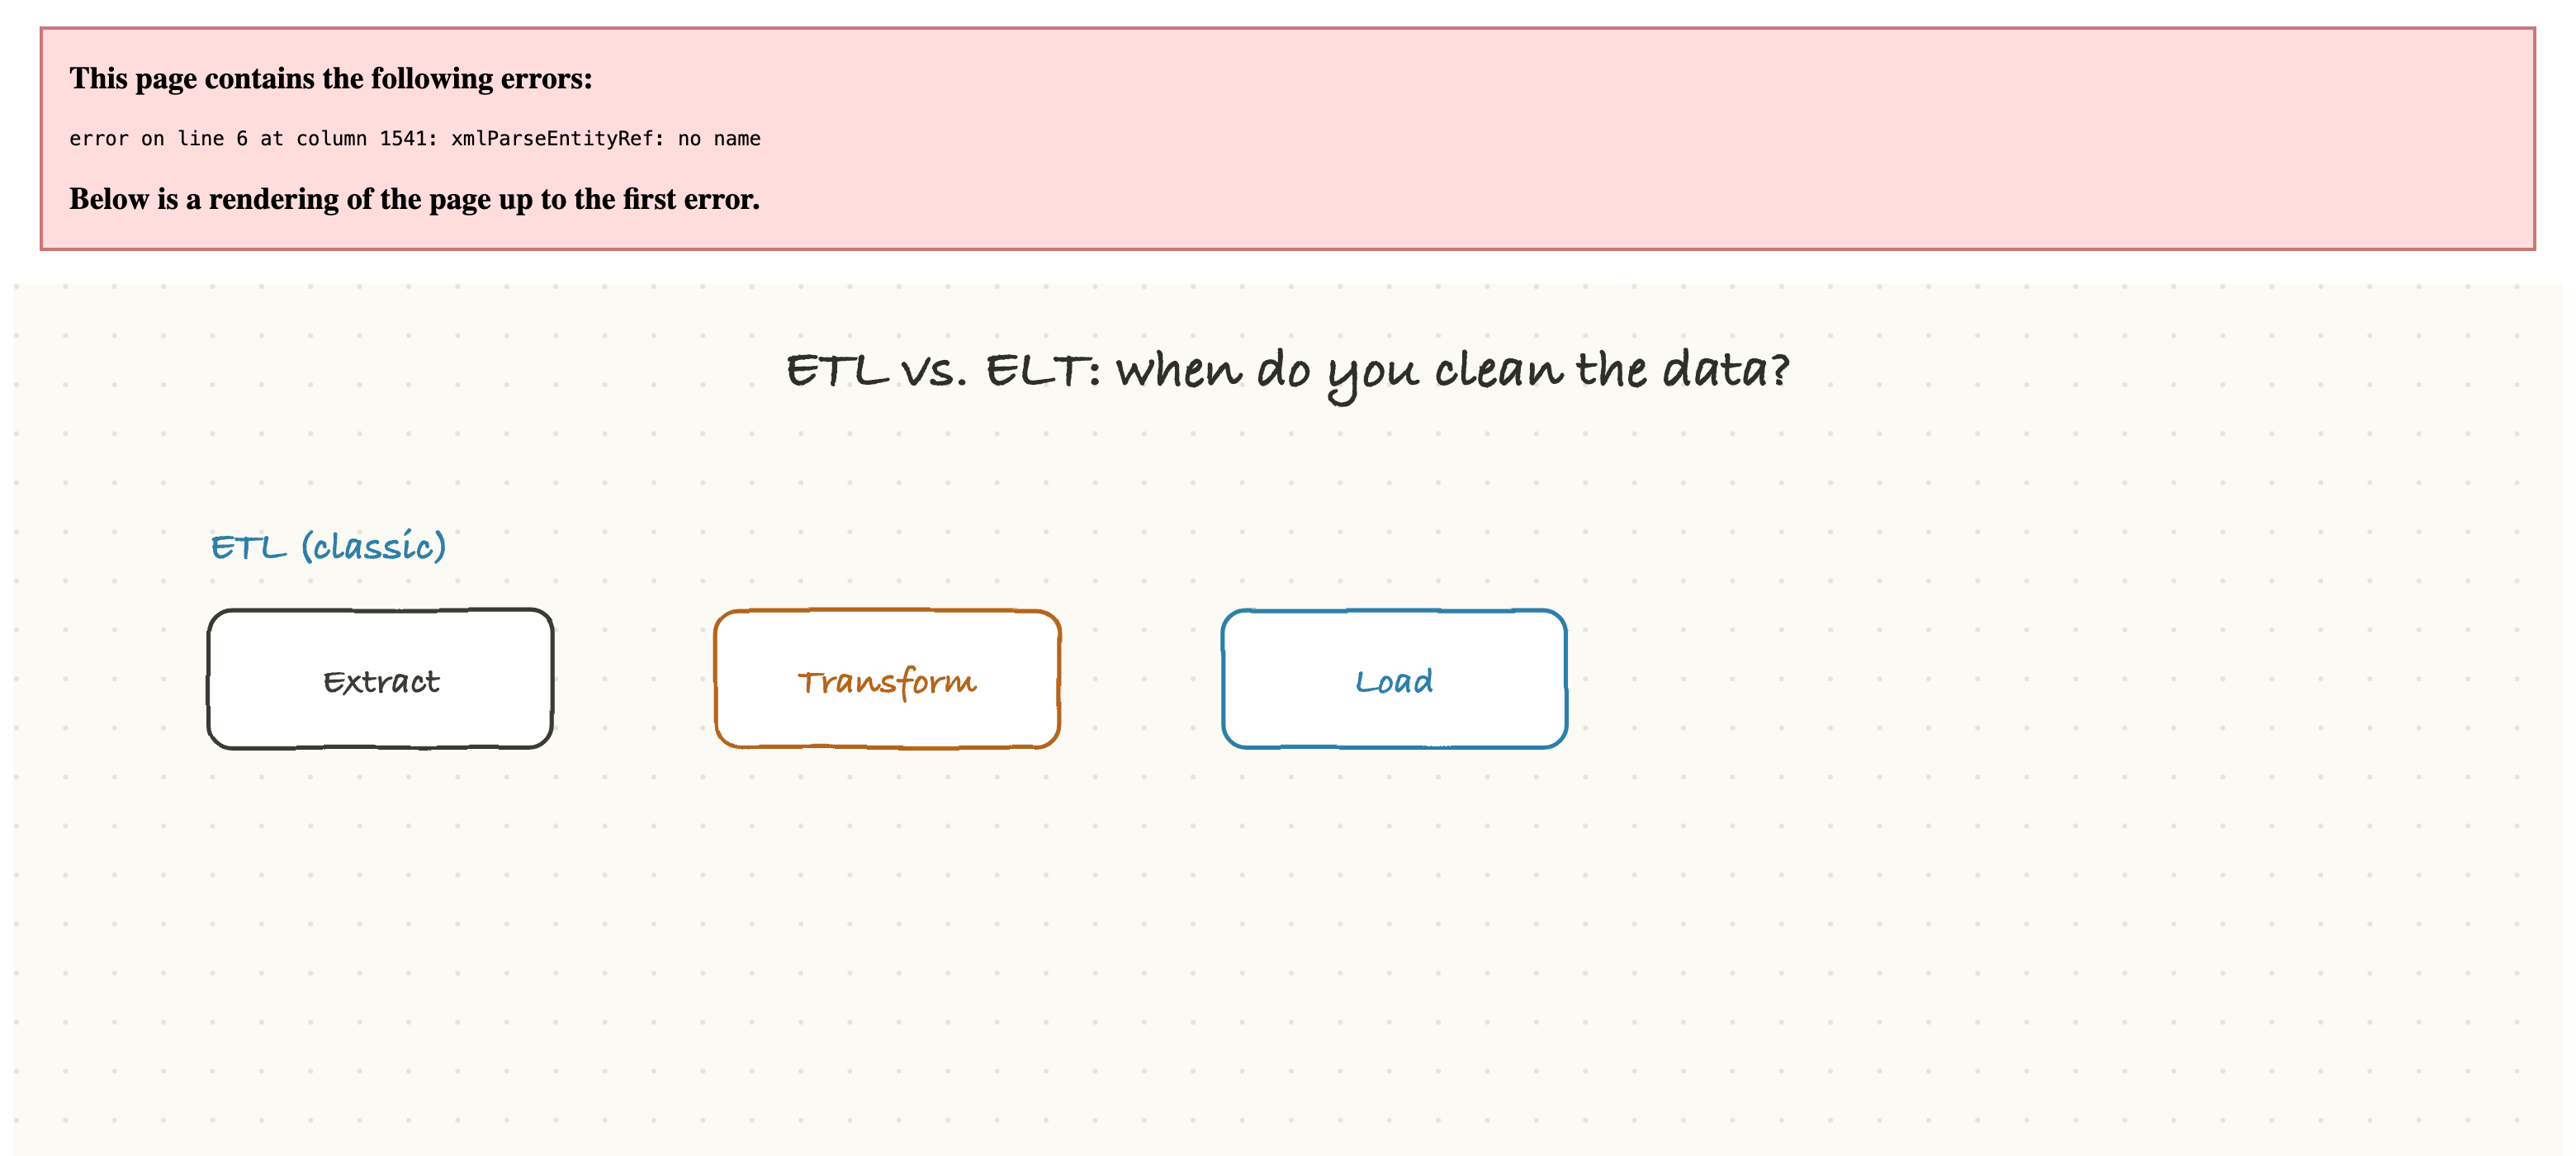
The classic approach is ETL: extract, transform, then load, you clean and shape the data first, and only load the tidy result. This made sense when storage and compute were expensive and you couldn't afford to keep messy raw data around. The modern approach is ELT: extract, load, then transform, you load the raw data first and transform it later, inside the powerful warehouse or lakehouse. ELT has become popular because storage is now cheap and analytical compute is elastic, so it's affordable to keep all the raw data and reshape it as many different ways as you want, whenever a new question comes up, without having to re-extract from the source.
The whole pipeline
Put it all together and you get the shape of a modern analytics stack, which is worth being able to picture as a whole.
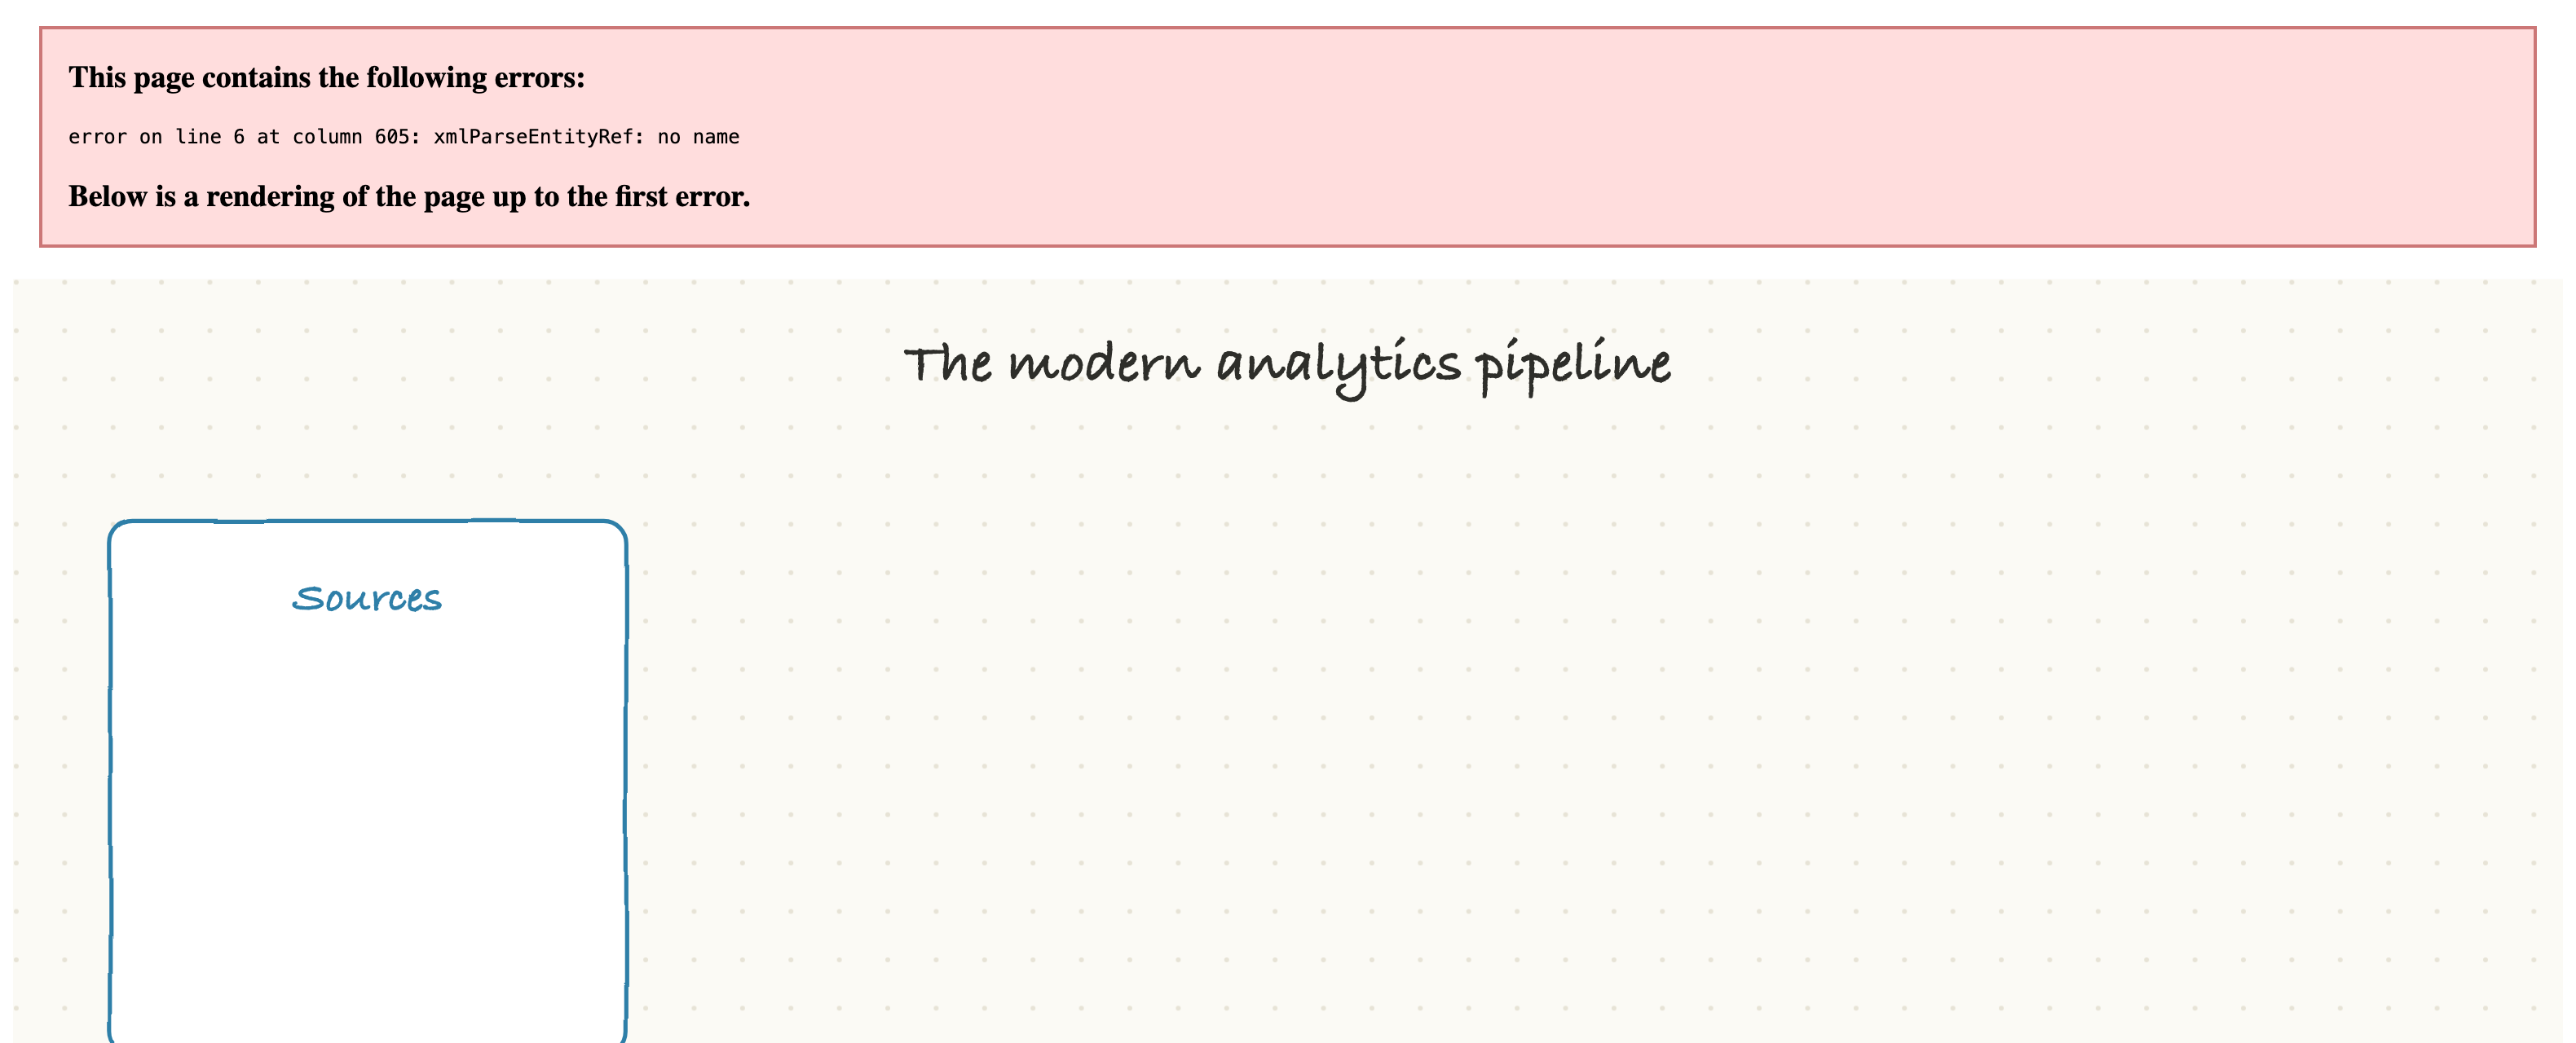
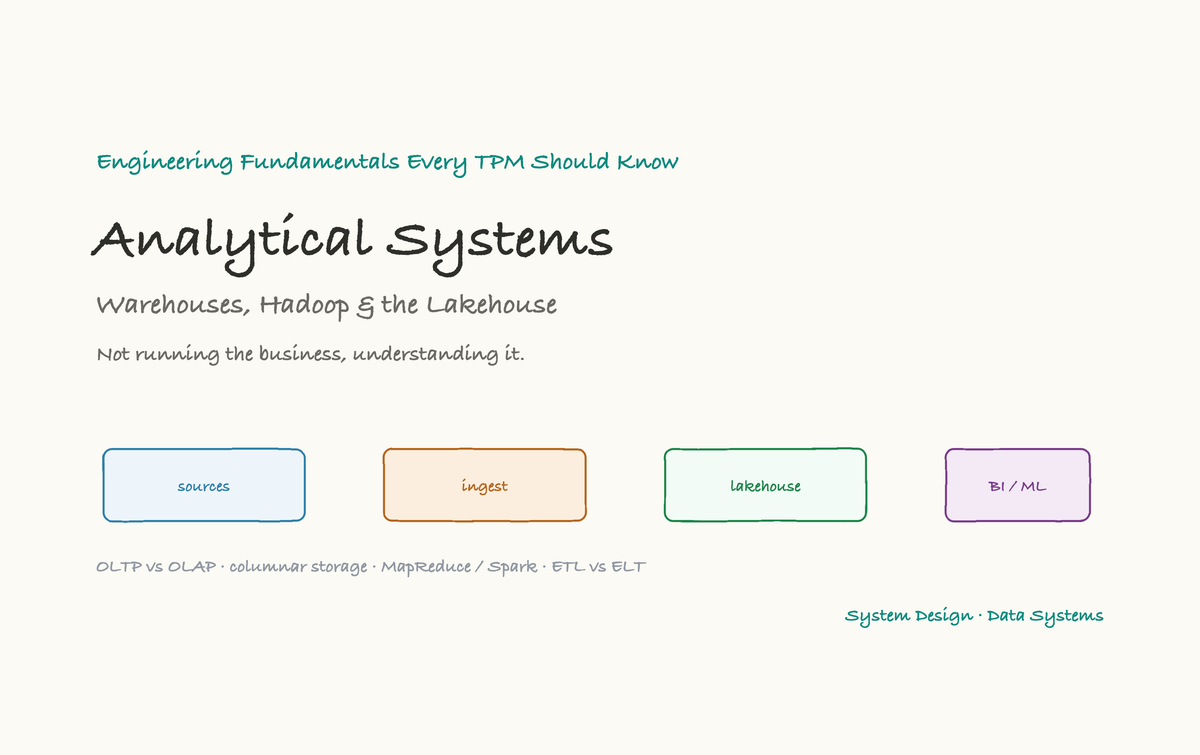
Data is born in sources, the operational databases, clickstream events, and third-party APIs. It's pulled in by an ingest layer, using batch and streaming tools like Spark and Kafka running ETL or ELT jobs. It lands in storage, a lake, warehouse, or lakehouse, in columnar files. And finally it's consumed, by BI dashboards, reports, metrics, and the training of machine-learning models. That left-to-right flow, from where data is created to where it becomes decisions, is the backbone of how organizations turn raw activity into insight.
Keep analytics off the operational database
If there's one practical rule to carry away, it's this one.
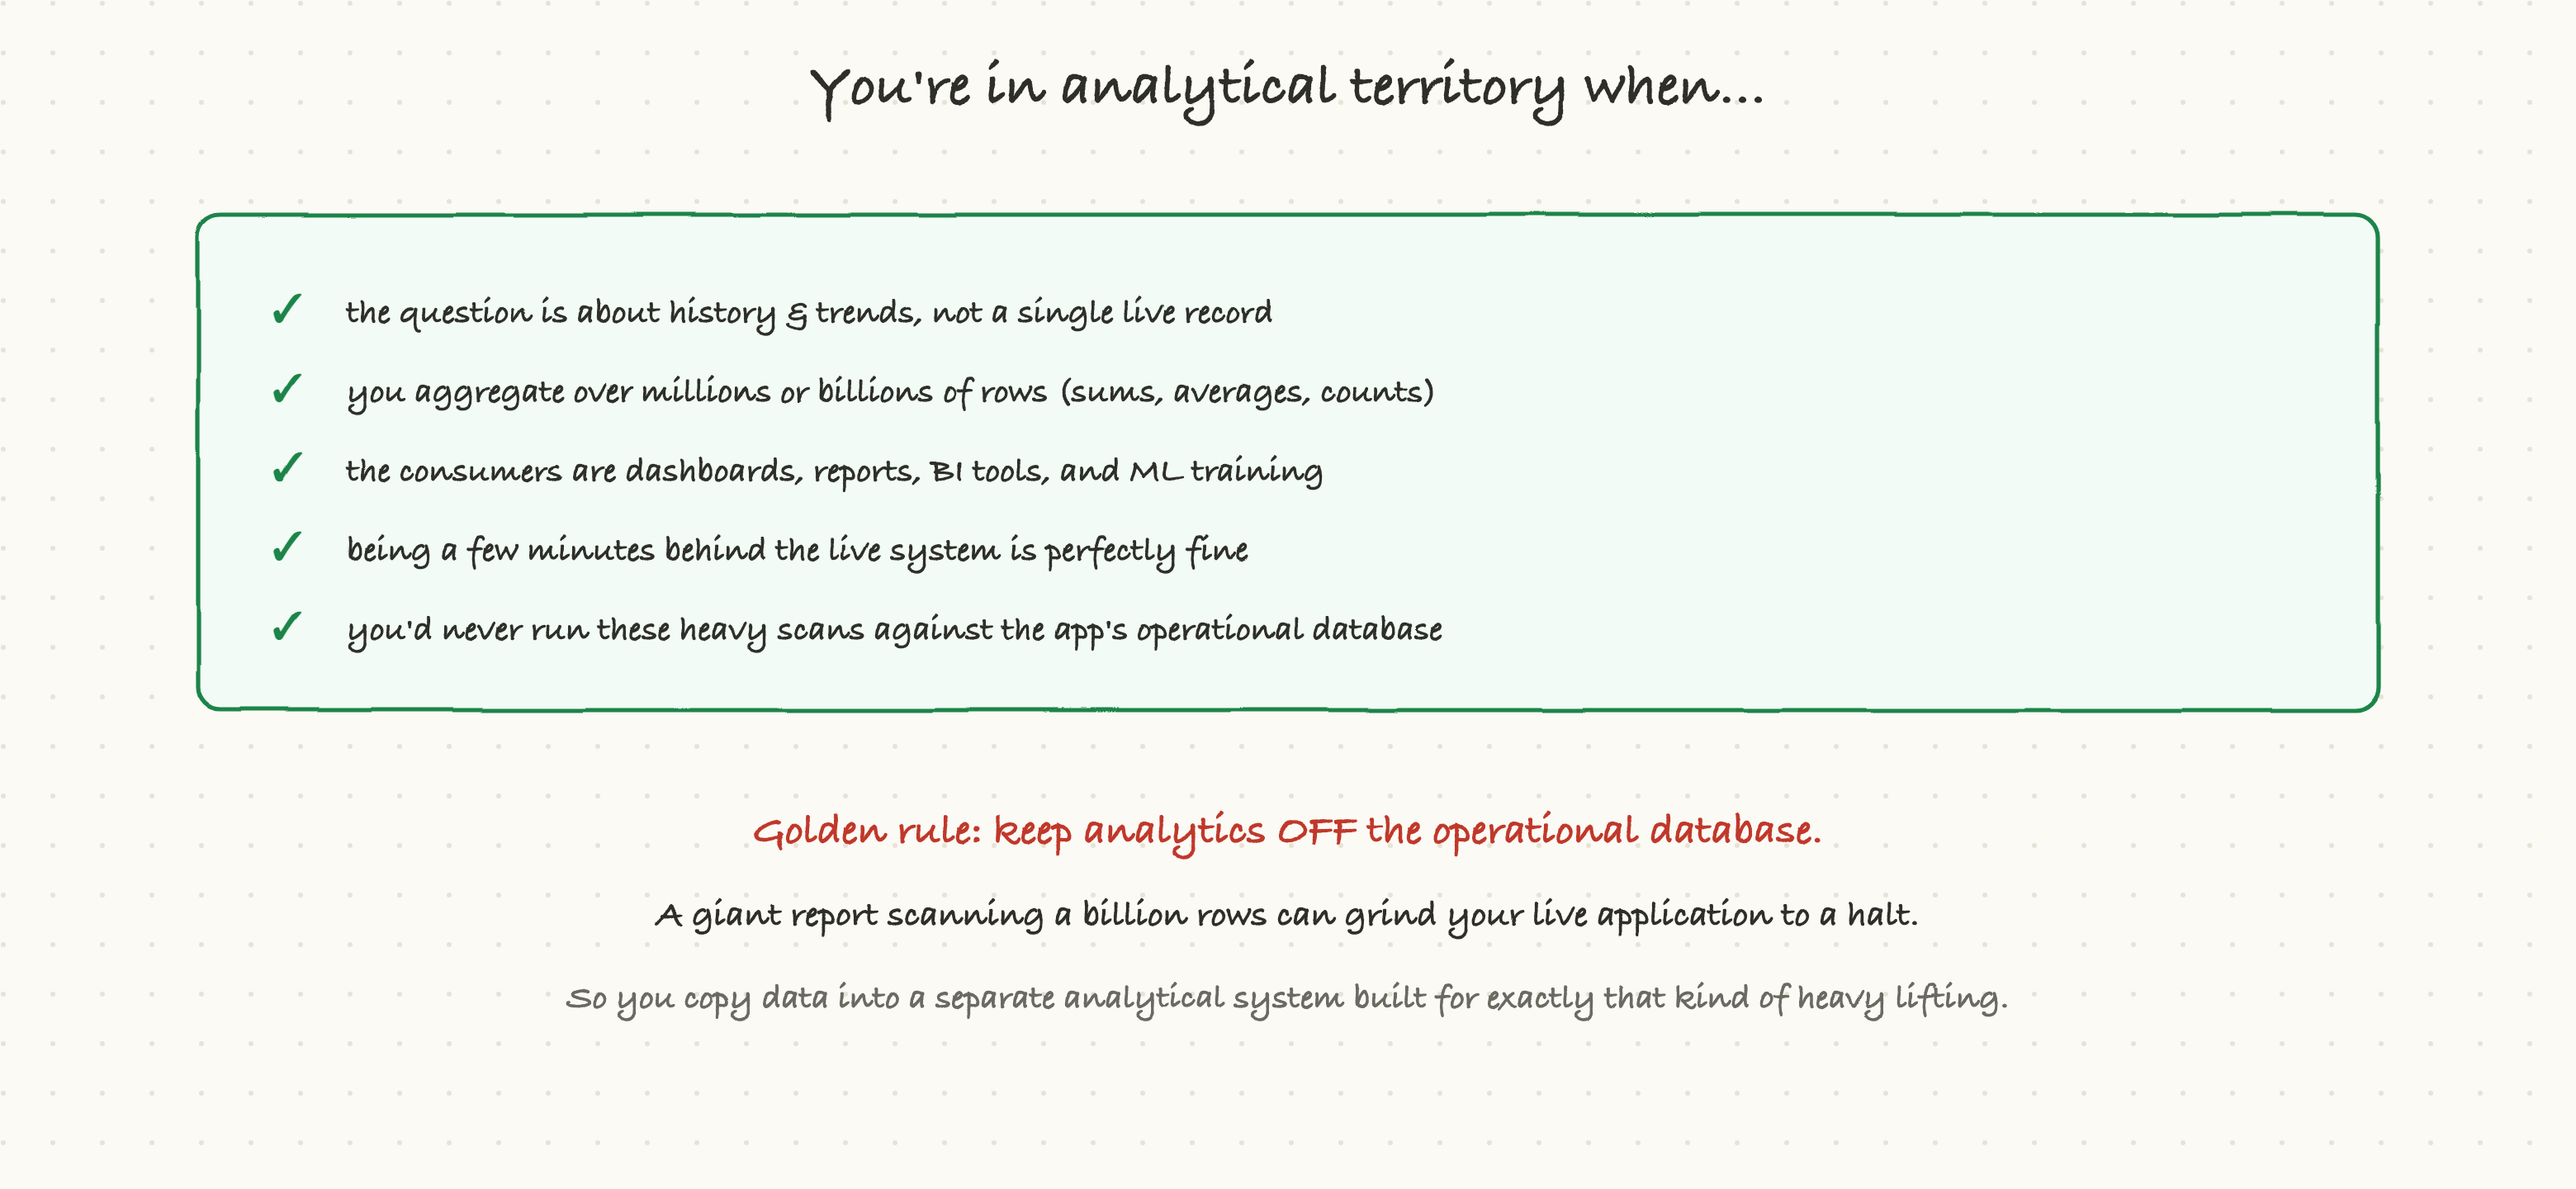
You're doing analytical work when the question is about history and trends rather than a single live record, when you're aggregating over huge numbers of rows, when the consumers are dashboards and ML rather than the live app, and when being a few minutes behind reality is perfectly fine. And the golden rule that follows: keep that heavy analytical work off your operational database. A report that scans a billion rows can grind your live application to a halt, starving real customers of resources while it runs. That's exactly why the data gets copied into a separate analytical system, built from the ground up for heavy lifting, so the elephant and the hummingbird never have to fight over the same plate.
Why a TPM should care
Analytics systems are where a lot of a company's decision-making and data-product value lives, and they come with their own rhythms and risks:
- "Operational" and "analytical" are different worlds with different teams and timelines. A request for a new dashboard or metric isn't a quick change to the app; it usually flows through a whole pipeline, ingestion, storage, transformation, and reporting, often owned by a data or analytics team. Knowing that helps you scope and sequence data requests realistically.
- Data freshness is a real, negotiable requirement. Analytics data is typically a bit behind the live system, by minutes or hours, depending on the pipeline. "Why doesn't the dashboard match the app exactly?" is usually this lag, not a bug. How fresh the data needs to be is a requirement worth stating explicitly, because real-time analytics costs much more than once-a-day.
- Never let heavy reporting run against the live operational database. If someone proposes pointing a big analytics query or BI tool straight at the production application database, that's a reliability risk worth flagging. The standard, safe answer is a separate analytical system.
- The lakehouse and ELT are the modern defaults, and they affect cost. Cheap storage plus elastic compute changed the economics: teams now keep raw data and transform it on demand. That's powerful, but analytical compute (scanning huge datasets) can get expensive fast, so cloud cost on the analytics side is a real line item worth watching, just as the DevOps article warned.
The analytical branch of the data world is where raw activity becomes understanding: how the business is really doing, what customers actually do, which way the numbers are heading. It's a separate discipline with its own systems precisely because answering big questions about everything is a fundamentally different job from serving one record right now. The next deep-dive returns to operational systems with a specialist built for one of the hardest problems in software: finding the needle in the haystack, the search engine.