Observability and Reliability

How teams know a system is healthy, and how they decide how healthy it needs to be
There is an old engineering saying: you cannot fix what you cannot see. A running system is a black box from the outside, millions of things happening per second, and the only way to know whether it is healthy, and to find out why when it is not, is to deliberately build in ways to observe it. That is observability. And once you can see how reliable a system is, the next question is how reliable it should be, because perfect reliability is impossibly expensive and nobody actually needs it. That is reliability engineering. This article is about both, and it is some of the most directly TPM-relevant material in the whole series, because reliability is a program, not just a feature.
You will not configure a monitoring stack. But "is it up?", "why is it slow?", "how reliable do we need to be?", and "what happened in that incident?" are central TPM questions, and this gives you the language to ask them well.
You cannot fix what you cannot see: the three pillars
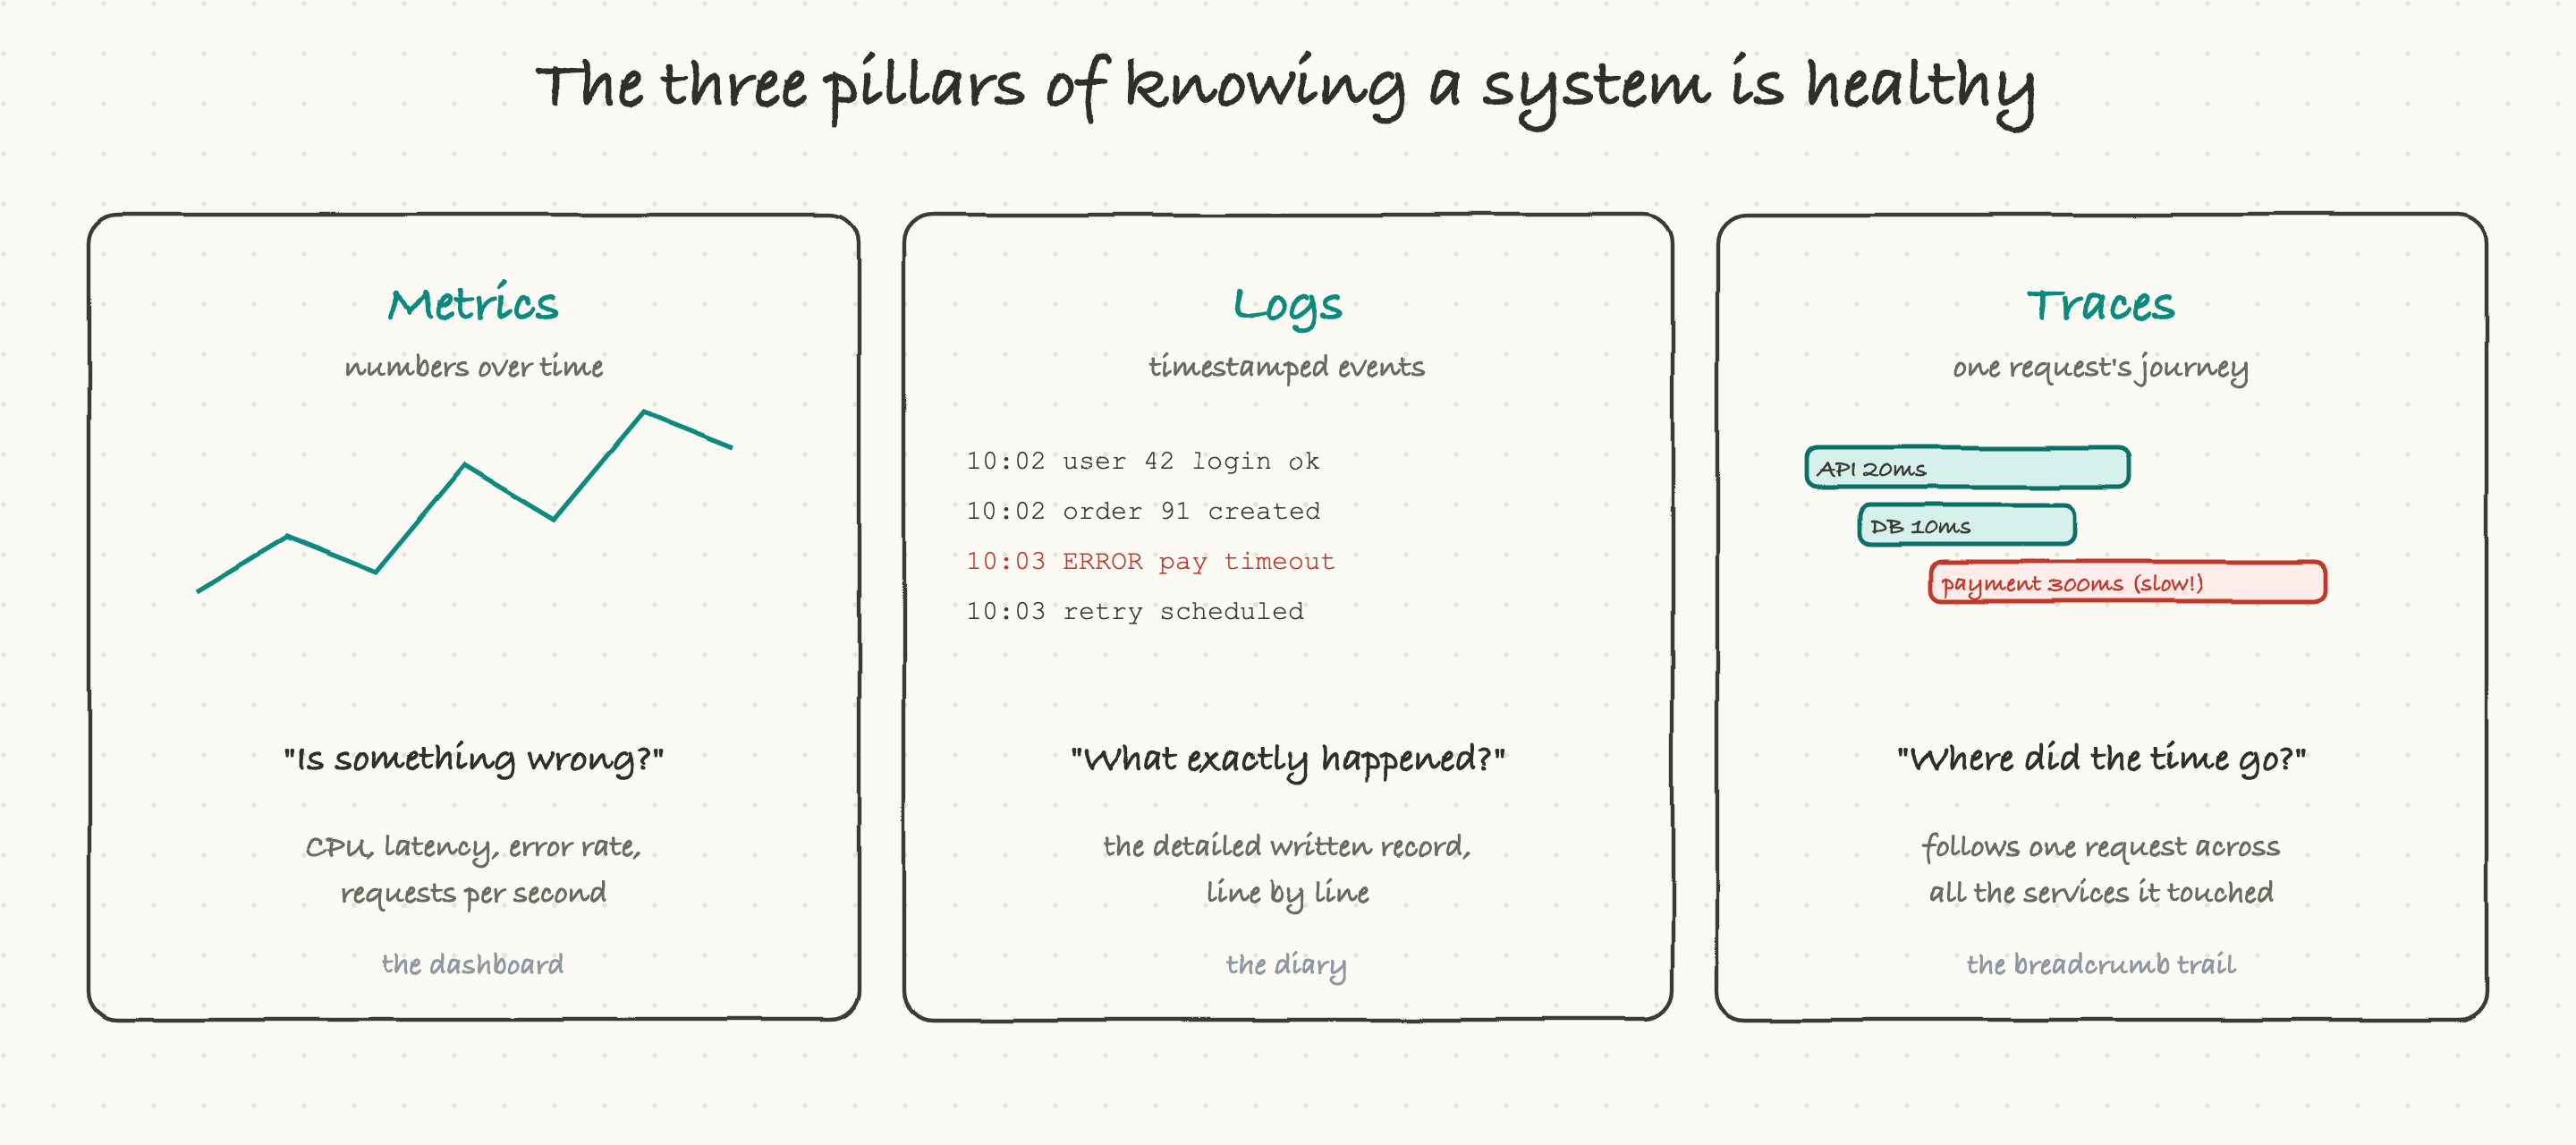
Observability rests on three kinds of data, and they answer three different questions.
Metrics are numbers over time: error rate, latency, requests per second, CPU usage. They live on dashboards and answer the question "is something wrong?" A spike in the error-rate graph tells you there is a problem, fast, but not what it is. Metrics are the vital signs.
Logs are timestamped records of individual events: "user 42 logged in," "order 91 created," "ERROR: payment timed out." They are the detailed written diary, and they answer "what exactly happened?" When a metric tells you something broke, logs tell you the specifics.
Traces follow a single request through every service it touches, recording how long each step took. They answer "where did the time (or the error) go?" In a system of many services, a trace is the breadcrumb trail that shows a request entering the gateway, calling auth, hitting the database, then the payment service, with the time spent at each.
Together these three give you both the alarm (metrics), the detail (logs), and the path (traces). A team with all three can diagnose almost anything; a team missing one is flying partly blind.
Following one request: distributed tracing
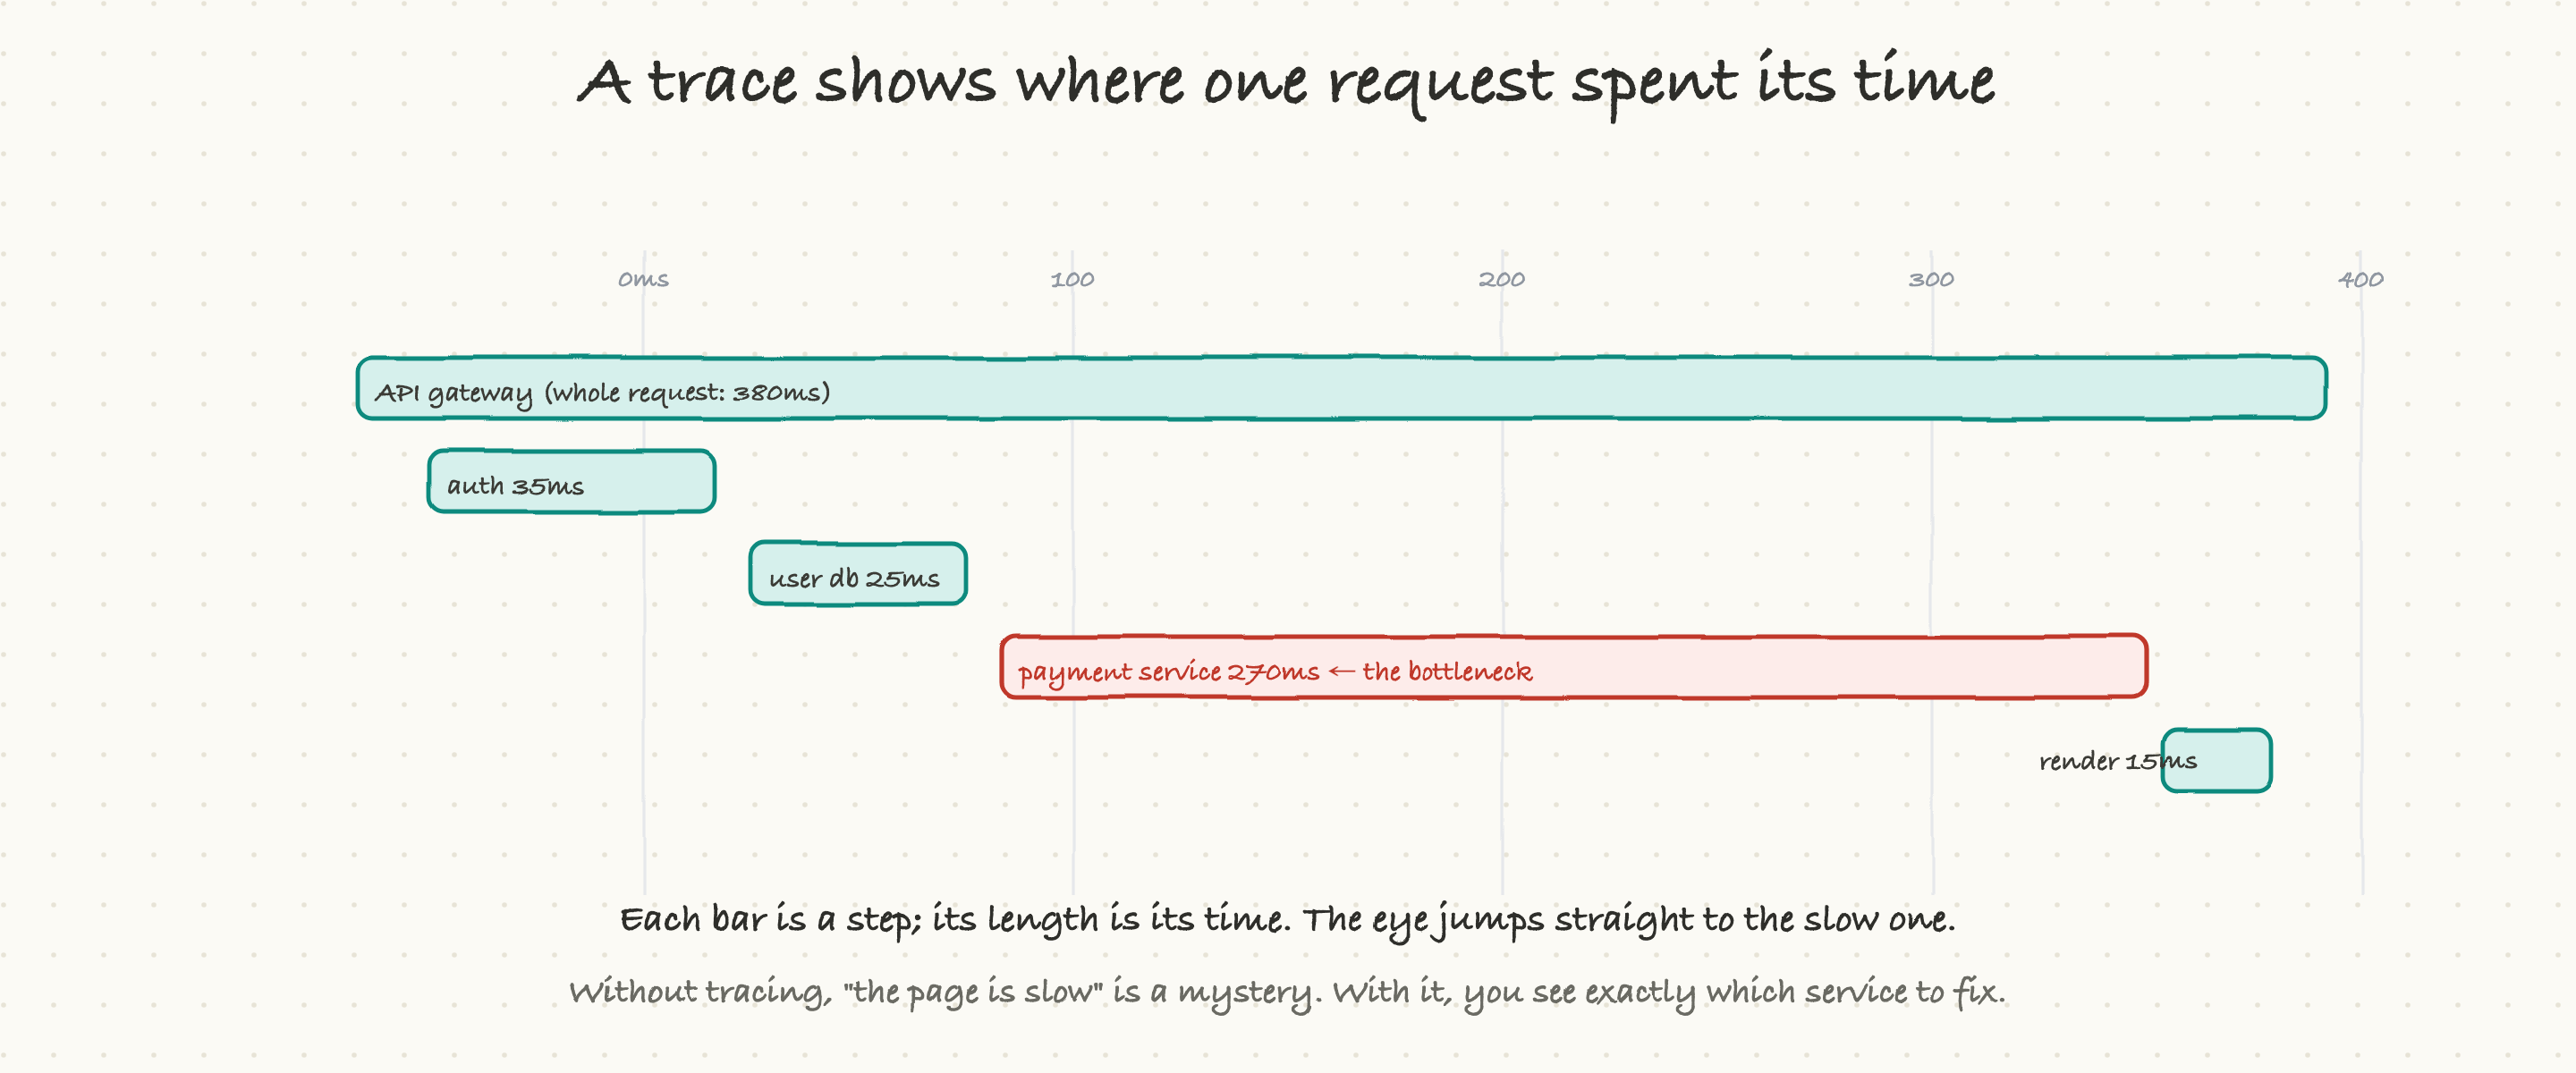
Tracing deserves its own moment, because it solves a problem that gets brutal in modern systems. When one user request fans out across a dozen services, and the page is slow, where is the time going? Without tracing, this is a miserable guessing game, each team insisting their service is fine.
A trace makes it visible at a glance. It lays out the request as a series of bars, one per step, each bar's length being the time it took. The whole request took 380 milliseconds; auth took 35, the database 25, and the payment service 270. Instantly, the bottleneck is obvious: it is the payment service, and that is where to look. No arguing, no guessing.
This is why distributed tracing is essential once you have more than a handful of services. "The app is slow" stops being a mystery and becomes a specific, assignable finding: this service, this step, this much time. When a team says they "added tracing," this is the superpower they gained.
From data to action: monitoring and alerting
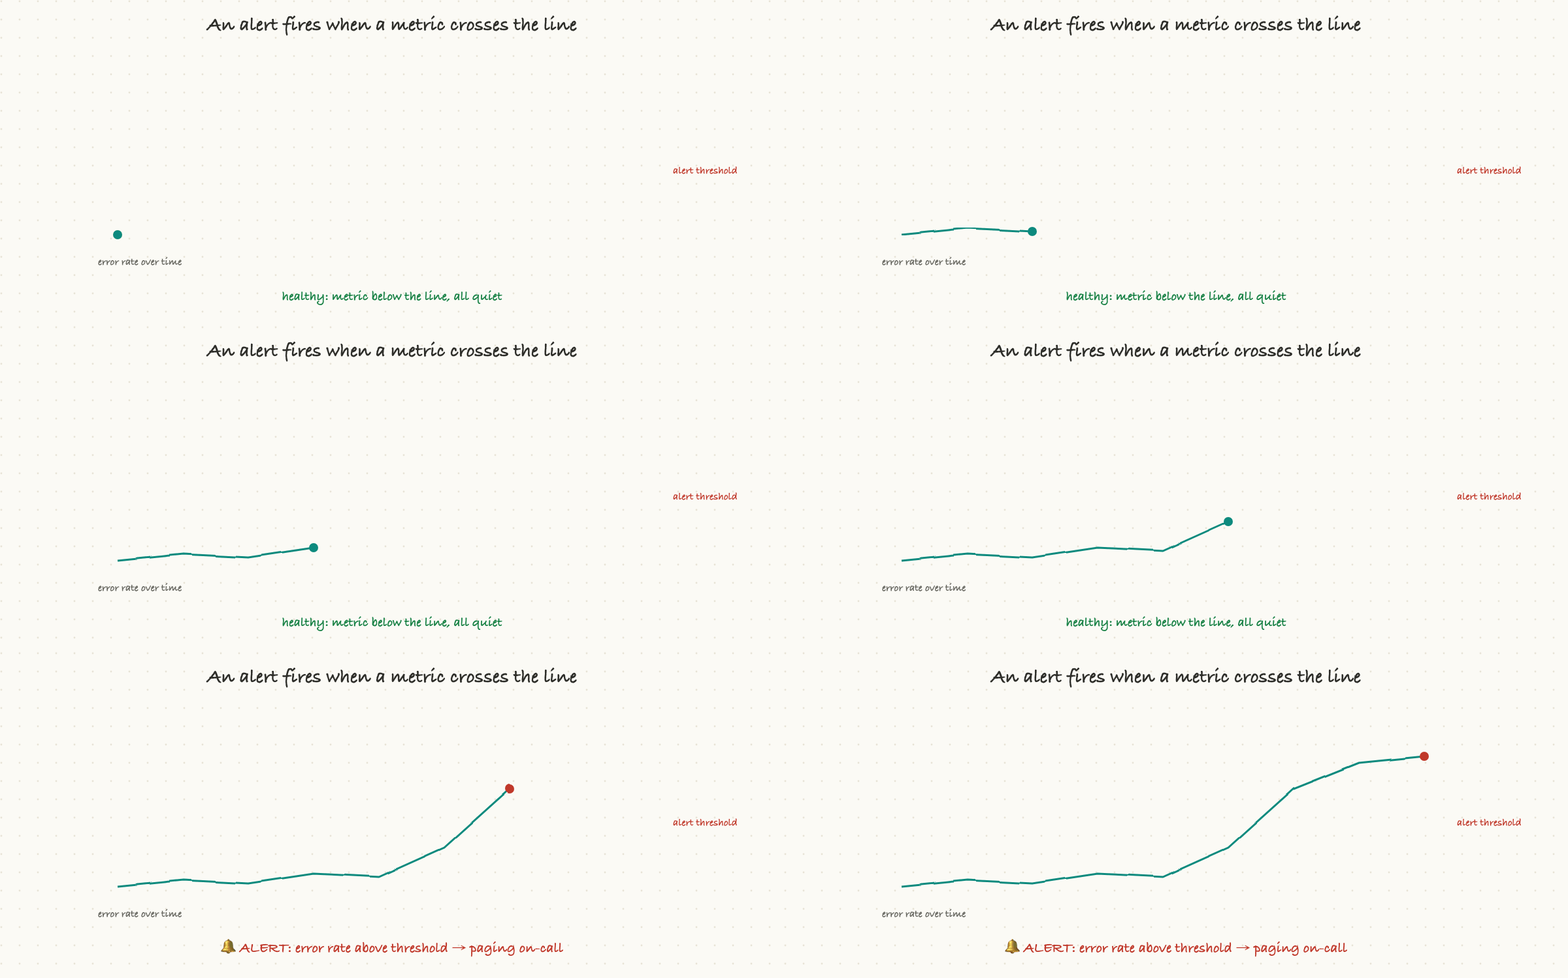
Collecting all this data is useless if a human has to stare at dashboards all day. Monitoring is the automated layer that watches the metrics for you, and alerting is what happens when something crosses a line.
You set thresholds, "if the error rate goes above 1 percent," or "if latency exceeds two seconds", and when a metric crosses one, an alert fires and pages whoever is on call. This is what lets a small team run a large system: they do not watch, they get woken up only when something actually needs them.
The hard part of alerting is not technical, it is judgment. Alert on too little and real problems slip by silently. Alert on too much and you get alert fatigue, where on-call engineers are paged so often by noise that they start ignoring alerts, including the one that matters. Good alerting fires on symptoms users actually feel (errors, slowness) rather than on every internal twitch. When a team complains about "too many pages" or "we missed it because there was no alert," this balance is what they are wrestling with.
How reliable is reliable enough? SLI, SLO, SLA
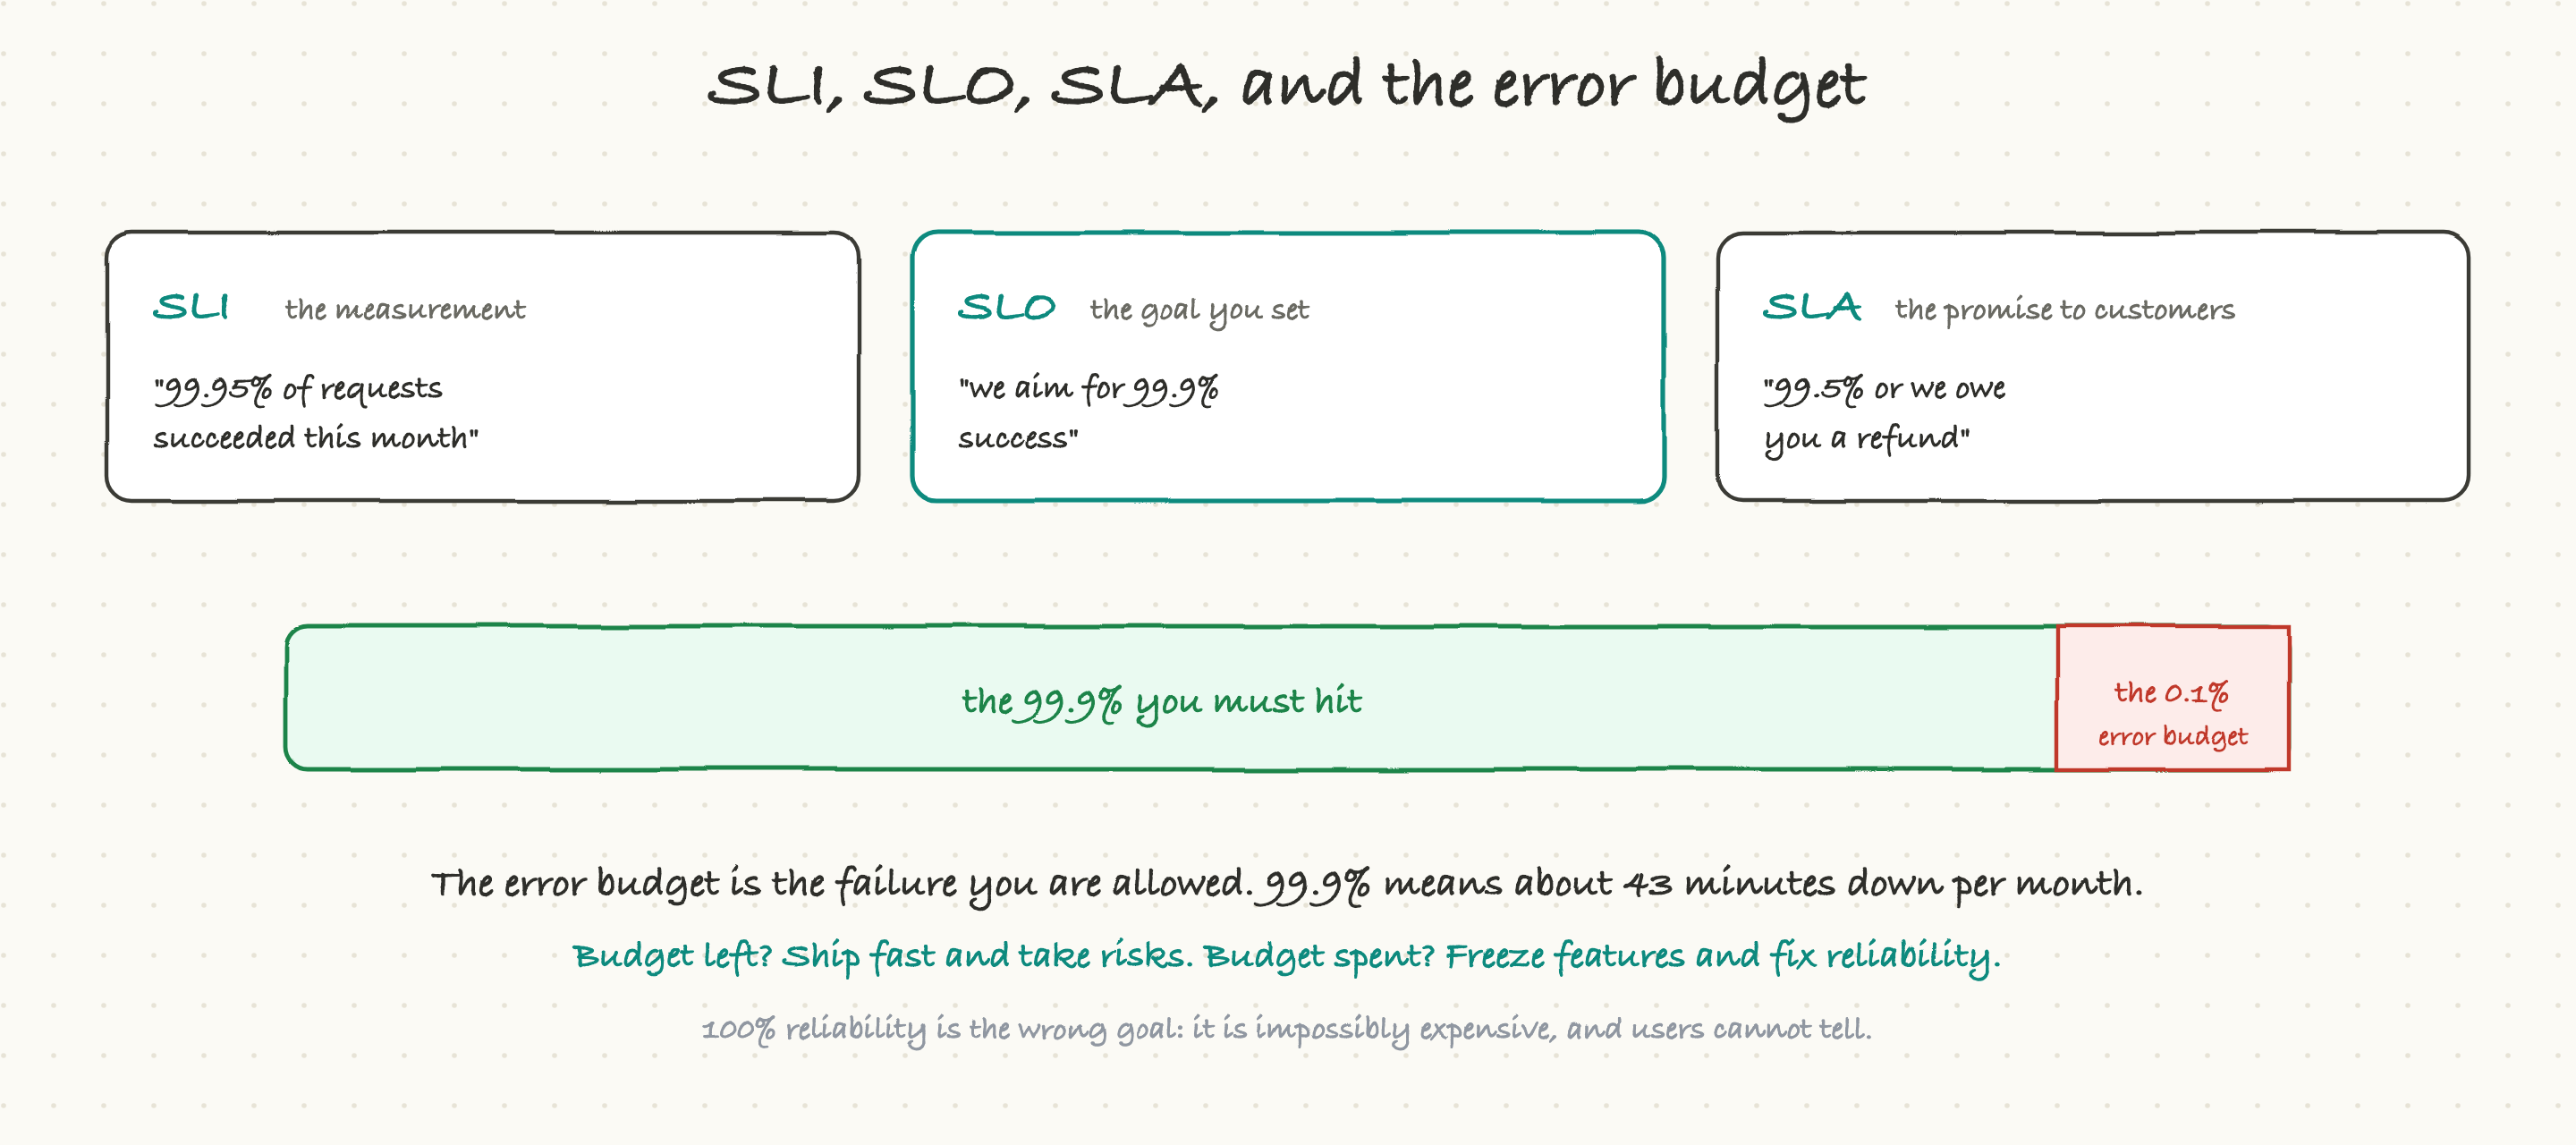
Here is the most important reliability idea for a TPM, and it has three acronyms that are simpler than they look.
An SLI (service level indicator) is a measurement of how you are doing: "99.95 percent of requests succeeded this month." An SLO (service level objective) is the goal you set for yourself: "we aim for 99.9 percent." An SLA (service level agreement) is a promise made to customers, usually with consequences: "99.5 percent or we refund you." SLI is reality, SLO is the target, SLA is the contract.
The genius idea that falls out of this is the error budget. If your objective is 99.9 percent reliability, then you are explicitly allowing 0.1 percent failure, that 0.1 percent is your budget for things to go wrong, and it equals roughly 43 minutes of downtime a month.
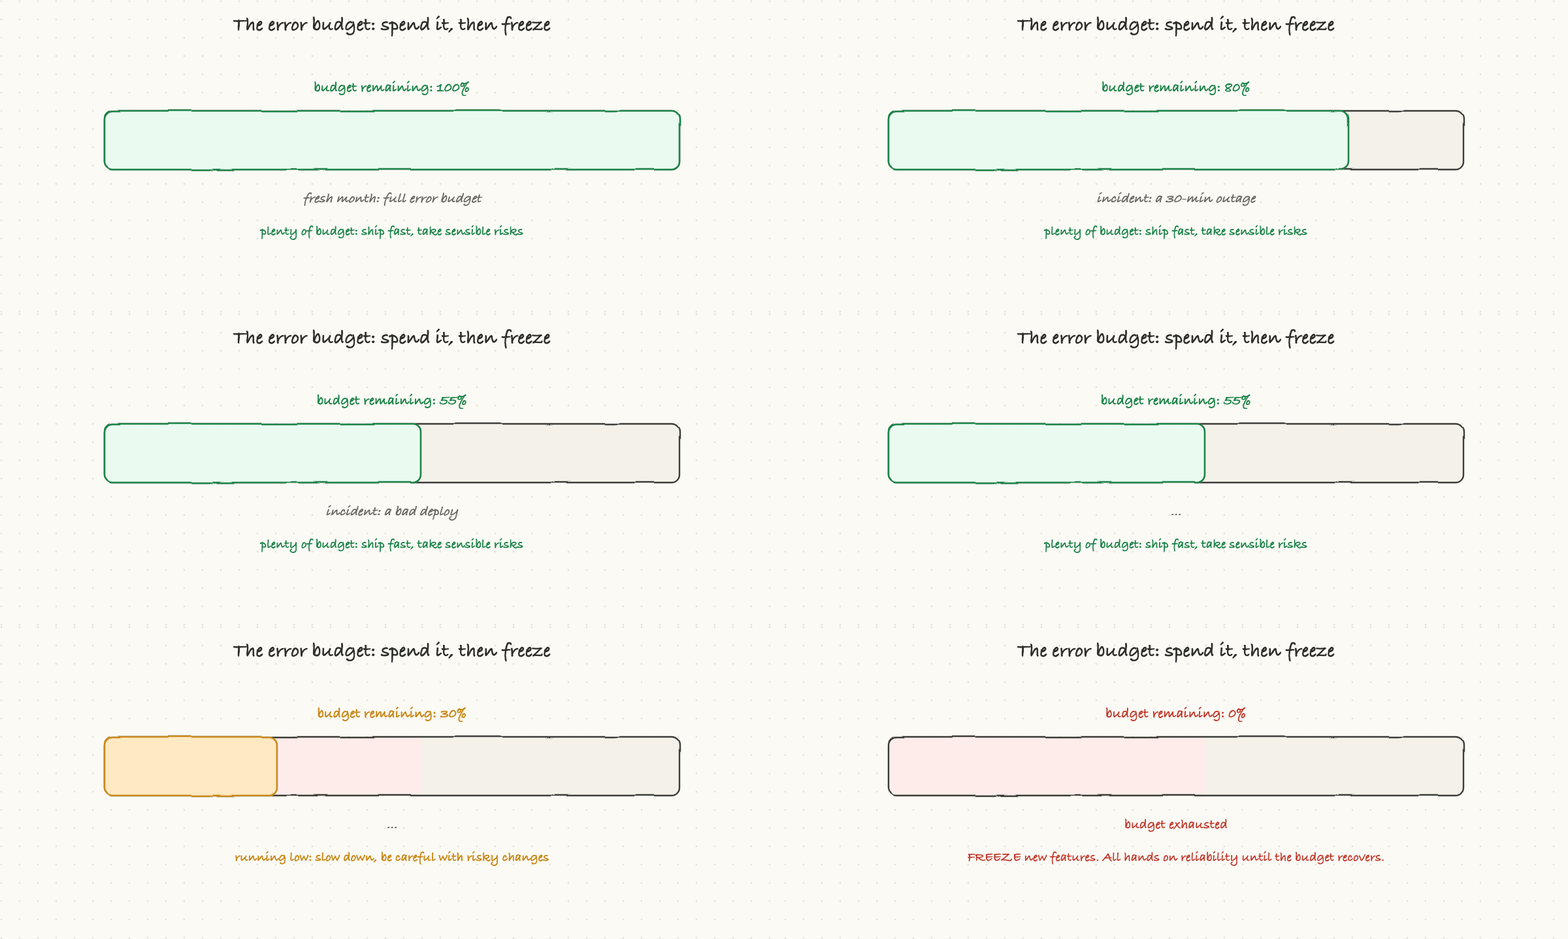
This reframes reliability beautifully. If you have error budget left, you can afford to move fast, ship risky features, and take chances, because a little failure is within budget. If you have burned through your budget with outages, you stop shipping features and put everyone on reliability until it recovers. The error budget turns the eternal tug-of-war between "ship fast" and "stay stable" into a simple, data-driven rule. And it makes explicit the truth that 100 percent reliability is the wrong goal: it is astronomically expensive, and users genuinely cannot tell the difference between 99.99 percent and perfect. When a team debates "what's our SLO" or "we're out of error budget," this is the framework, and it is one a TPM should actively drive.
The nines, and what they really cost
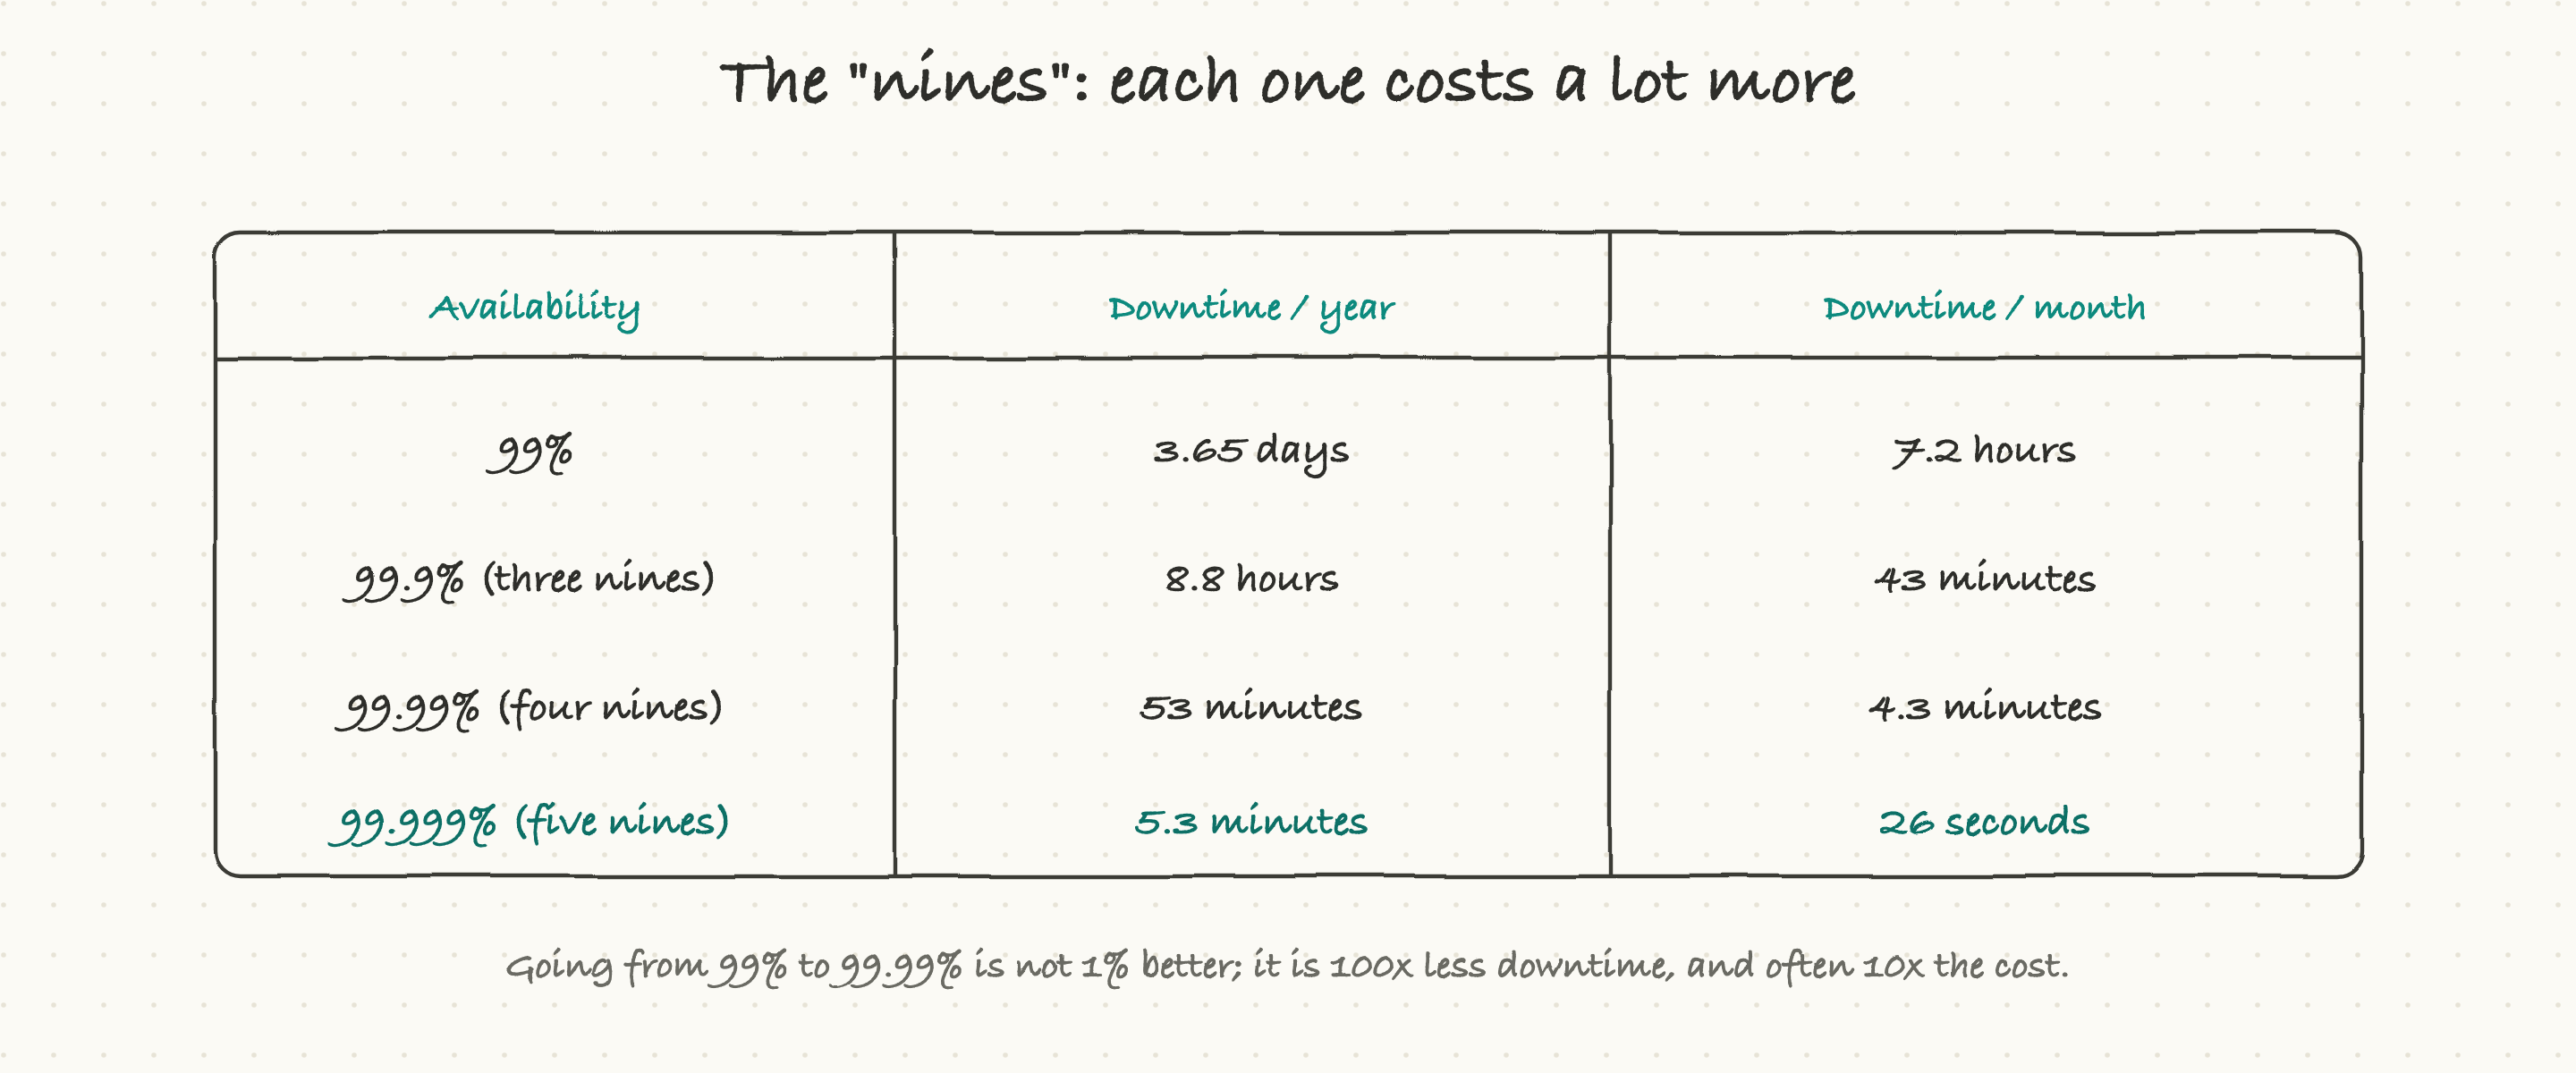
Reliability is measured in "nines," and the jump between them is bigger than it sounds. 99 percent availability sounds great until you realize it allows 3.65 days of downtime a year. Three nines (99.9 percent) brings that to about 8.8 hours a year, or 43 minutes a month. Four nines (99.99 percent) is 53 minutes a year. Five nines (99.999 percent) is the famous gold standard at about 5 minutes a year.
The crucial point is that each additional nine is not a small improvement, it is roughly a tenfold reduction in allowed downtime, and it often costs many times more to achieve, requiring more redundancy, more automation, and more engineering effort. Going from 99 percent to 99.99 percent is a 100x reduction in downtime, and a huge increase in cost and complexity. So the real question is never "how reliable can we be," it is "how reliable do we need to be," because aiming a service that does not need it at five nines burns enormous money for value nobody will notice. Picking the right number of nines for each service is one of the most consequential, and most overlooked, decisions a team makes.
When it breaks: incident response
No matter how reliable a system is, it will break, and how a team handles that is part of reliability too. A good incident process has a few traits worth recognizing. There is a clear on-call rotation so someone always owns the response. There are agreed severity levels so everyone knows how big a deal it is. The focus during the incident is on recovery first, mitigate and restore service, then find root cause later. And afterward there is a blameless postmortem: a written analysis of what happened and how to prevent it, focused on fixing the system, not punishing a person.
That blamelessness matters more than it seems. When people are punished for mistakes, they hide them, and the organization stops learning. When postmortems are blameless, people surface problems honestly and the system genuinely gets more reliable over time. Two numbers often track this: MTTR (mean time to recovery, how fast you bounce back) and MTBF (mean time between failures, how often things break). Reliability work is mostly about pushing MTTR down and MTBF up. A TPM often owns the incident process itself, and a calm, blameless, well-rehearsed one is a real competitive advantage.
Planning for disaster: RTO and RPO
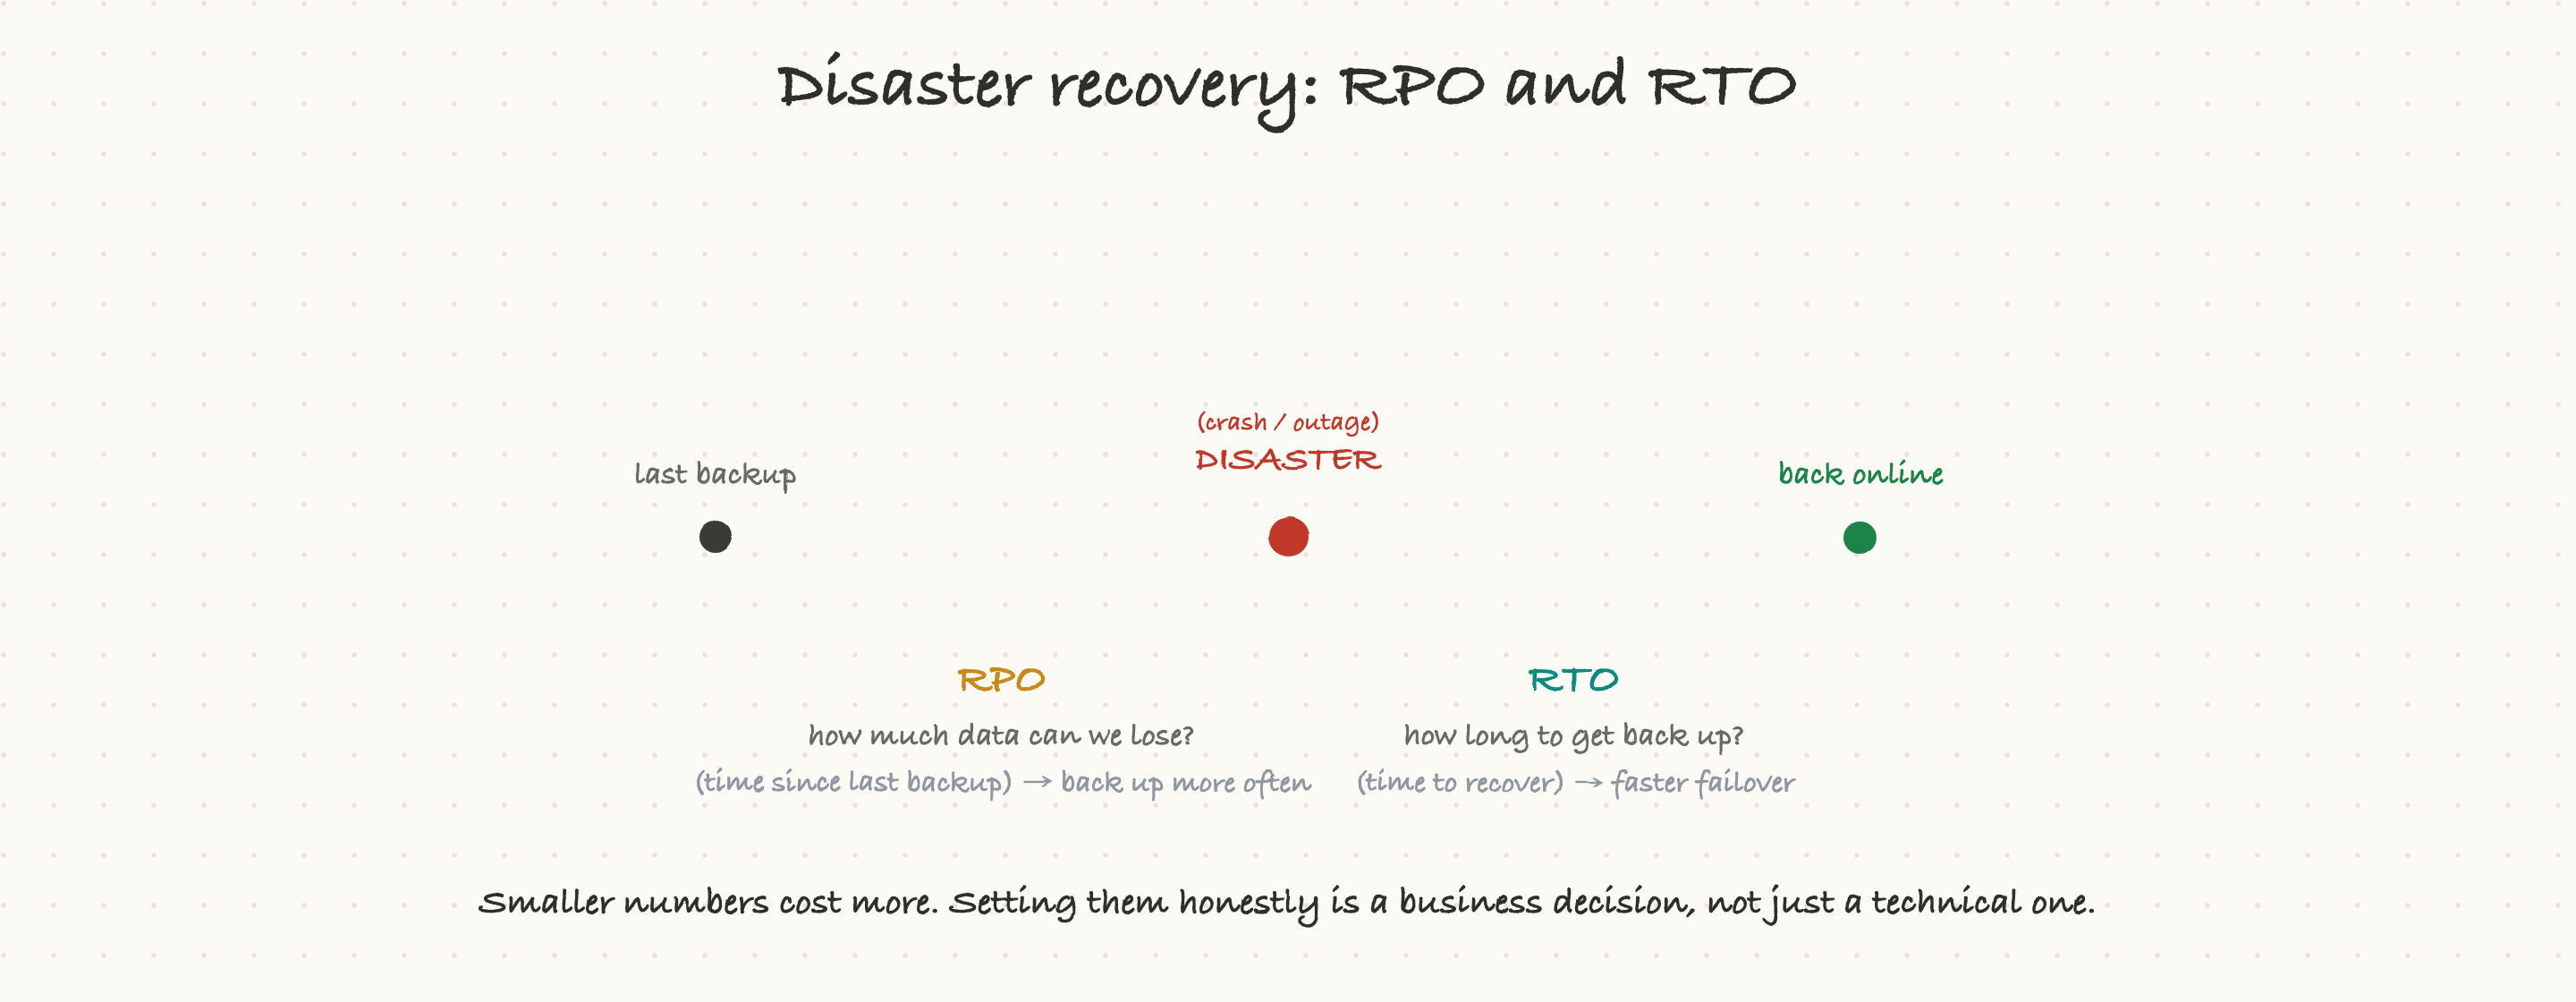
Finally, the big one: what happens in a real disaster, a data center fails, a database is corrupted, a region goes dark? Two numbers define your plan, and they are worth knowing precisely.
RPO (recovery point objective) asks how much data you can afford to lose, measured as the time since your last good backup. If you back up every hour, your RPO is an hour: a disaster could lose up to an hour of data. Want to lose less? Back up more often.
RTO (recovery time objective) asks how long you can be down, the time it takes to get back online after a disaster. An RTO of four hours means you have promised to be running again within four hours. Want to recover faster? Invest in automated failover and standby systems.
Both numbers cost more the smaller you make them, so they are business decisions, not just technical ones: how much data loss and downtime can the business actually tolerate in a true disaster? Setting them honestly, and then actually testing that you can hit them (an untested disaster-recovery plan is just a hope), is core reliability work. When a team says "our RTO is four hours, RPO is fifteen minutes," they are stating exactly how bad a disaster they have prepared for.
Why a TPM should care, and what to ask
Reliability is one of the areas where a TPM adds the most direct value, because it is fundamentally about programs, tradeoffs, and process, not just code. A few questions drive it:
Can we actually see this system, do we have metrics, logs, and tracing, or are we flying blind?
What is our SLO for this service, and are we measuring against it? (If there is no SLO, that is the first thing to fix.)
Do we have error budget left, and are we letting it guide how fast we ship versus how much we invest in stability?
How many nines does this service actually need, and are we over- or under-investing for that?
When something breaks, do we have on-call, alerts that fire on real symptoms, and blameless postmortems?
What are our RTO and RPO for a real disaster, and have we tested that we can hit them?
Ask those, and you will be driving the reliability conversation rather than reacting to outages, which is exactly where a strong TPM operates: turning "keep it running" from a vague hope into a measured, budgeted, well-rehearsed program.