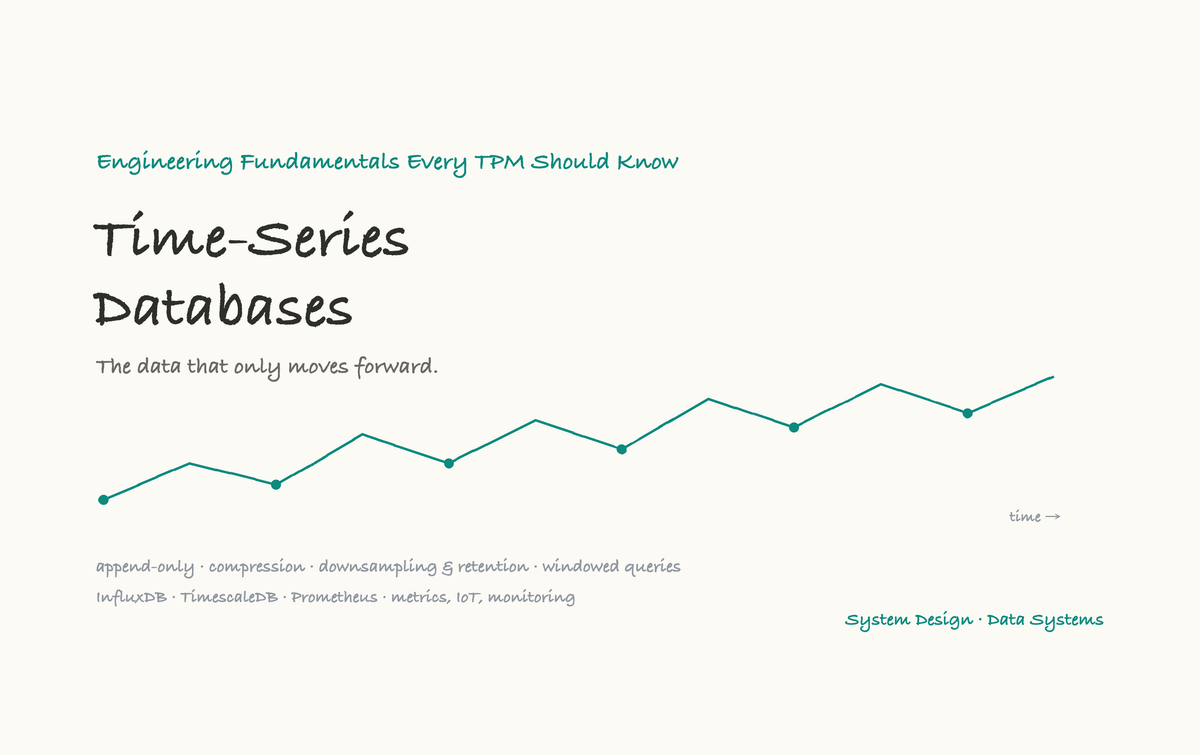
Time-Series Databases: The Data That Only Moves Forward

There's a kind of data that has quietly exploded in volume over the last decade, and you generate it constantly without thinking. Every time a server reports its CPU usage, every time an app records how long a request took, every time a thermostat notes the temperature, every time a fitness tracker logs your heart rate, a tiny stamped-with-time measurement is created. Multiply that by millions of servers, devices, and sensors each emitting readings every second, and you have one of the largest categories of data in the world: time-series data.
This deep-dive covers the database family built specifically for it. Time-series data has such a distinctive shape, and arrives in such torrents, that the general-purpose databases and even the other specialists we've covered handle it awkwardly. Time-series databases (InfluxDB, TimescaleDB, and Prometheus are the common names) are tuned for one job: absorbing endless streams of timestamped measurements and answering questions about them over time. Let's see what makes them special.
The shape of the data
A time-series data point is simple, and its simplicity is the whole story.
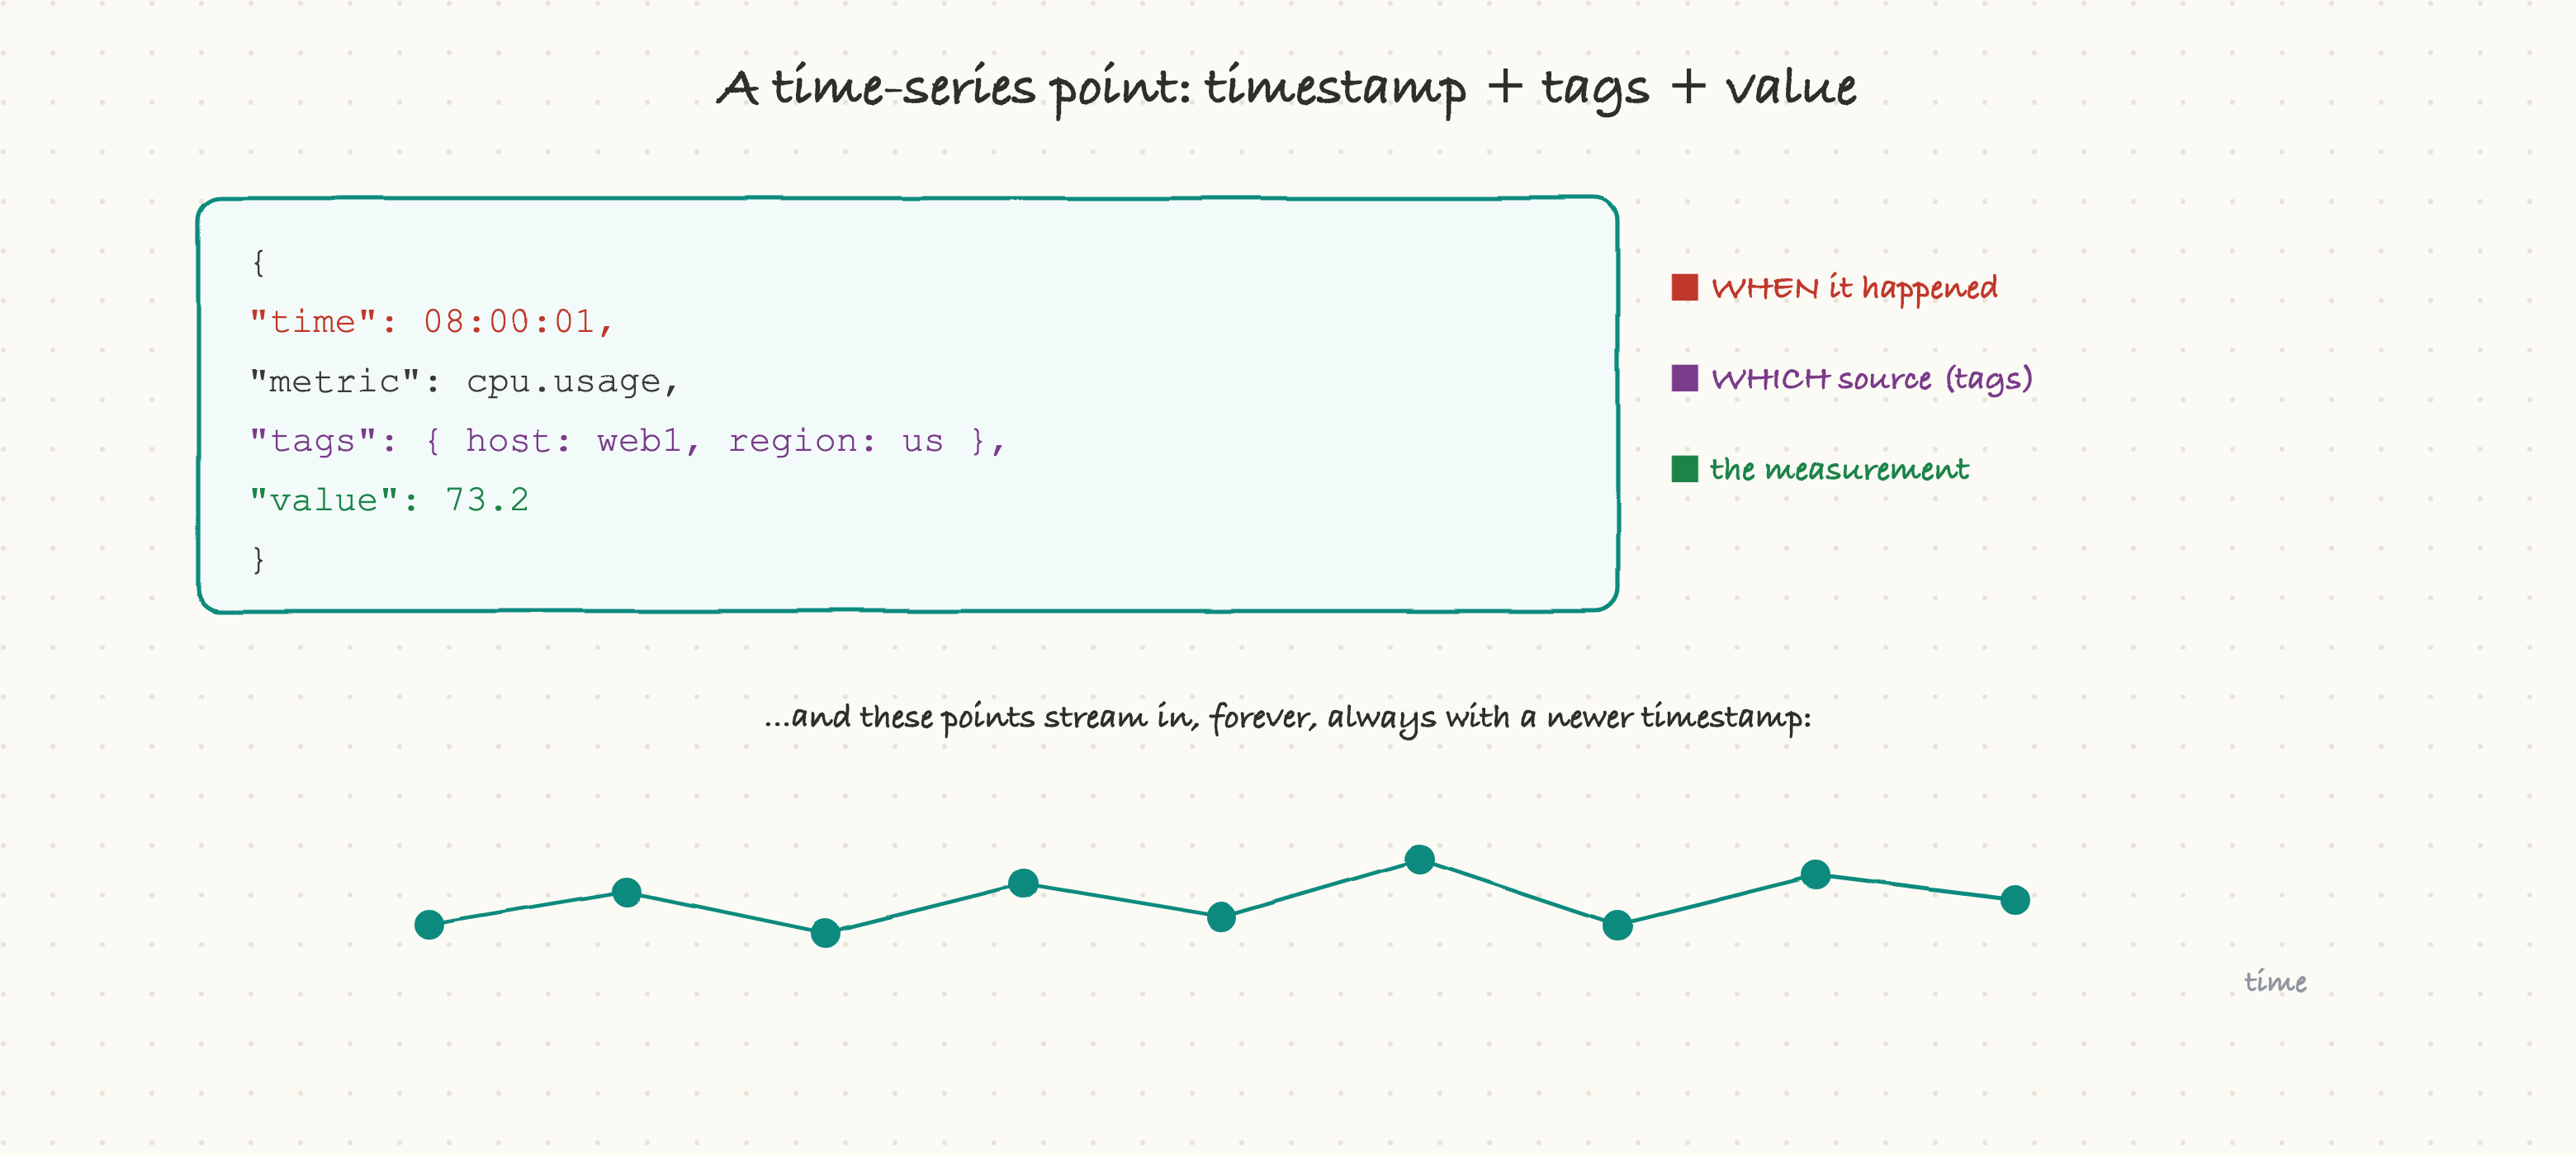
Every point has three parts: a timestamp (when), some tags that identify the source (which server, which sensor, which region), and a value (the actual measurement). That's it. A CPU reading is "at 08:00:01, host web1 in region us, cpu.usage = 73.2." And these points stream in relentlessly, always with a newer timestamp than the last, forever. The defining trait is right there: time is not just a field, it is the axis around which everything is organized. You never go back and edit an old reading; you only ever append new ones at the leading edge of now.
That single characteristic, append-only and time-ordered, is what separates this data from everything else and justifies a whole specialized database.
Why it needs its own database
To see why a general database struggles here, look at how time-series data is written and read. Both patterns are unusual, and both are extreme.
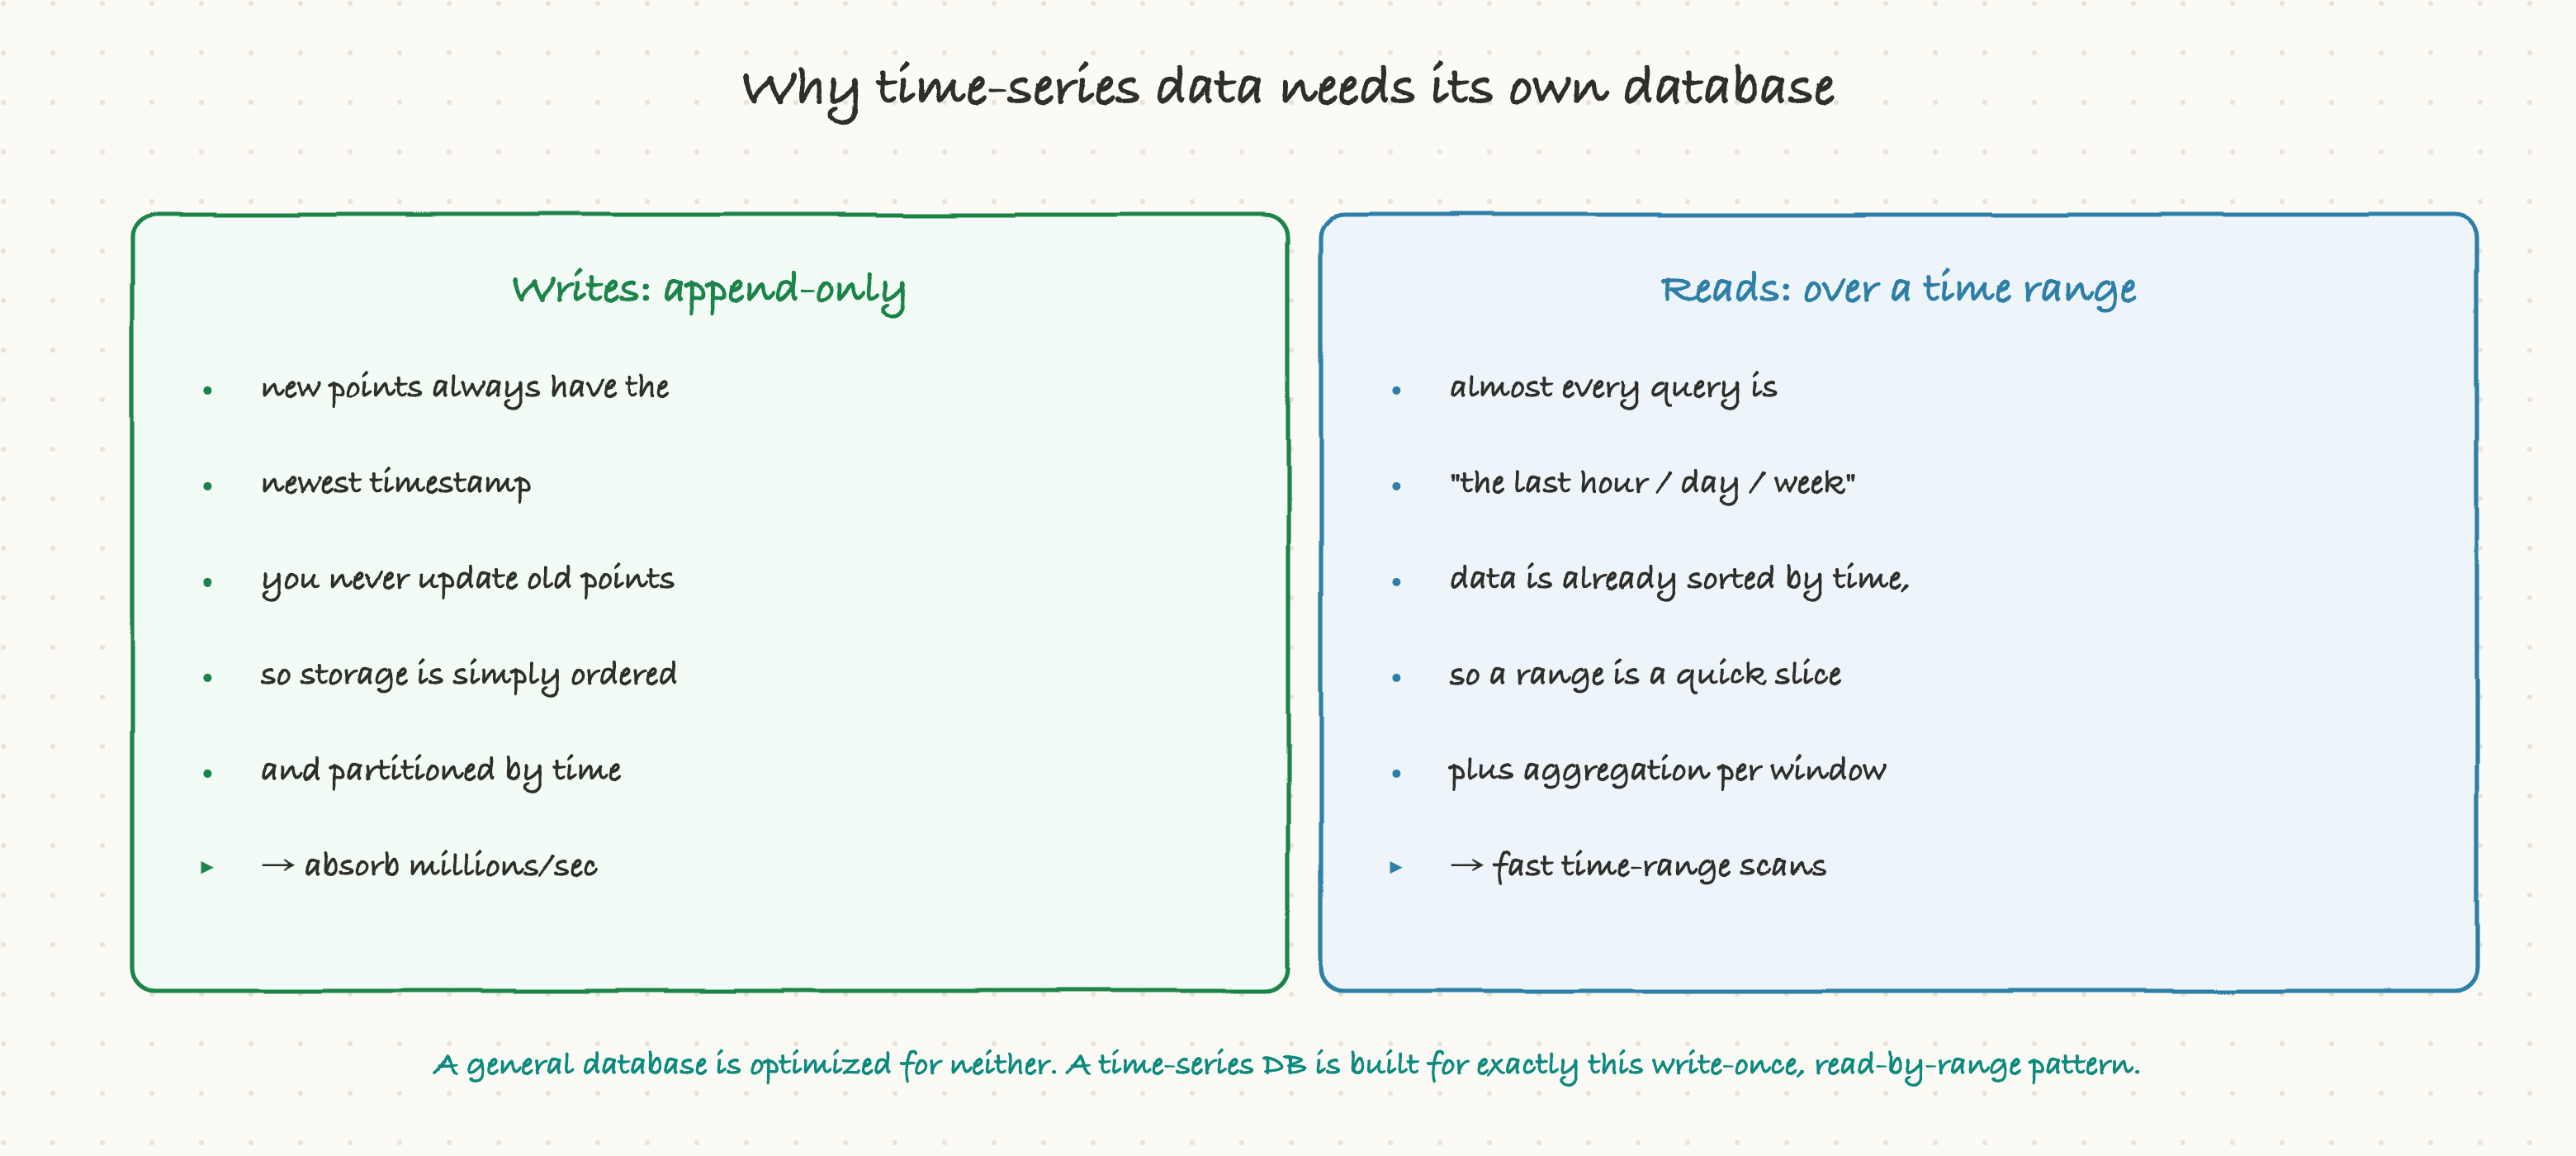
The write pattern is pure append. New points always carry the newest timestamp, and you never update existing ones. This is wonderful, because it means the database can store data simply in time order, partitioned into time-based chunks, and just keep tacking new data onto the end, which lets it absorb millions of points per second. The read pattern is equally distinctive: almost every query is over a time range, "the last hour," "yesterday," "this week," usually combined with an aggregation like an average or a maximum. Because the data is already physically sorted by time, grabbing a range is a fast, contiguous slice.
A general-purpose database is optimized for neither extreme: not for relentless append-only writes, and not for "scan this huge time range and summarize it." A time-series database is built for exactly this write-once, read-by-range rhythm, and that focus is why it can handle volumes that would crush a relational database.
Compression: the happy surprise
Here's a delightful property that falls out of the data's shape. Time-series data compresses astonishingly well, often by 10x or more, and understanding why reveals how clever these systems are.
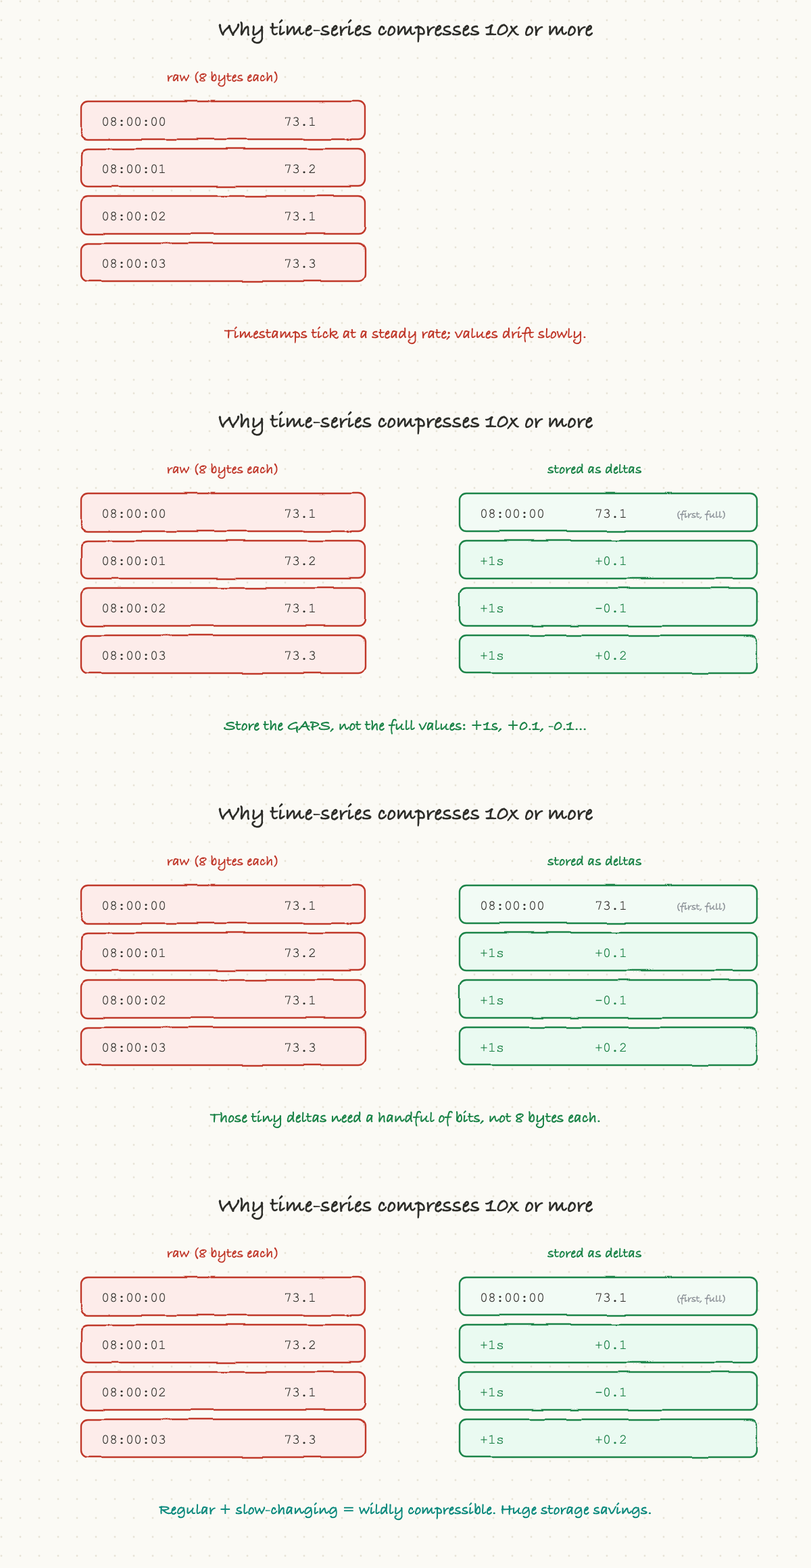
Two things make it compressible. First, timestamps usually tick at a steady rate (every second, every ten seconds), so instead of storing each full timestamp, you store the tiny gap between them: "+1 second, +1 second." Second, the values themselves usually change slowly, a CPU at 73.1% is probably near 73.2% a second later, so instead of storing each full number, you store the small difference from the previous one. These deltas need a fraction of the bits that the full values would, sometimes a handful of bits instead of eight bytes. The combination of regular timestamps and slowly-drifting values makes time-series data wildly compressible, which is exactly why these databases can store such enormous volumes affordably.
Downsampling and retention: not keeping everything forever
Even with great compression, storing every raw point forever would be wasteful, because nobody needs second-by-second detail from two years ago. So time-series databases have two more tricks: downsampling and retention.
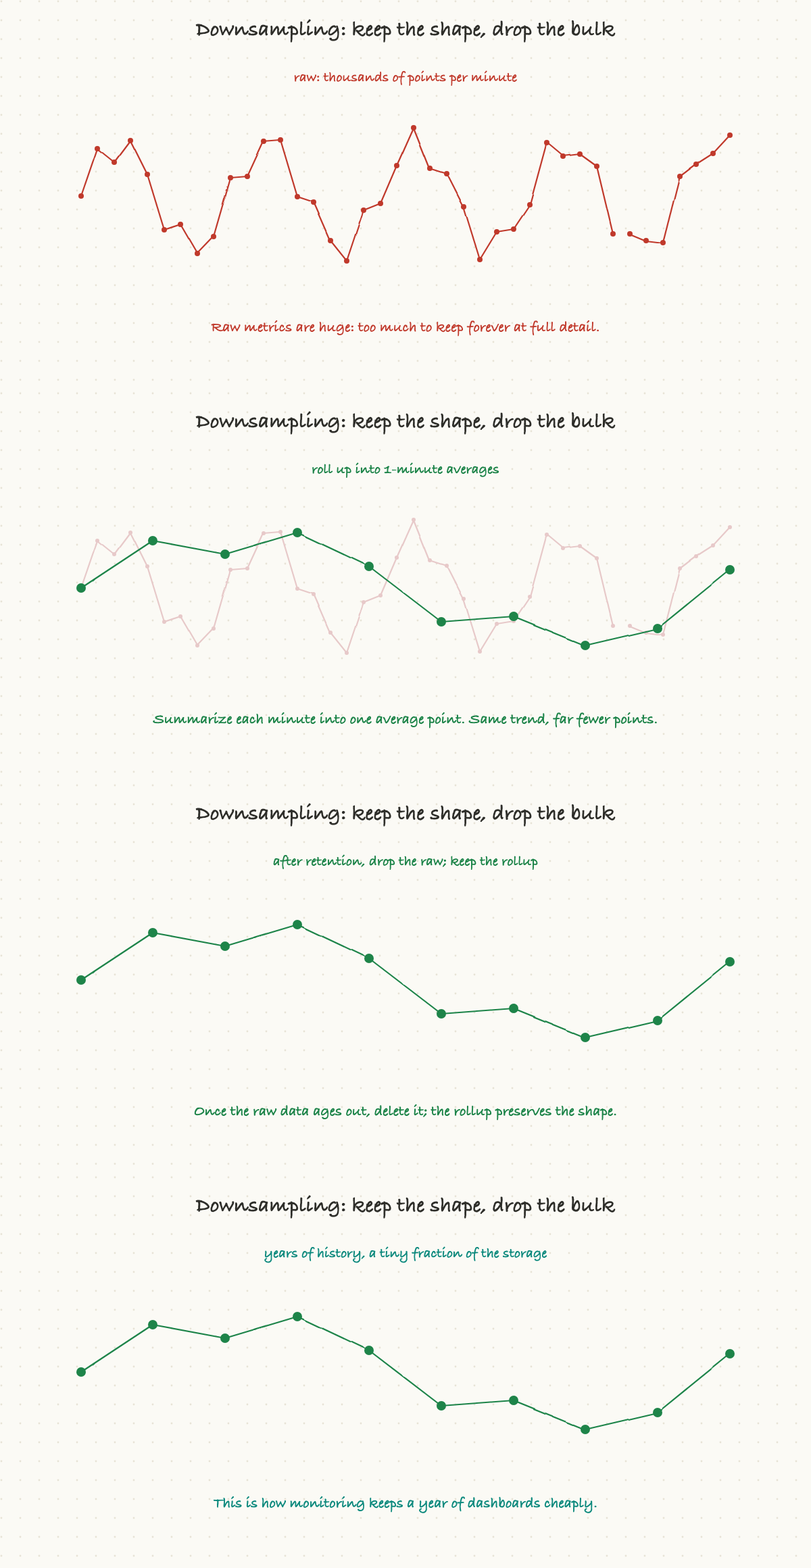
Downsampling means rolling up high-frequency raw data into lower-frequency summaries: take a minute's worth of per-second points and replace them with a single average (or max, or count) for that minute. You keep the shape of the history while dramatically shrinking the number of points. Then a retention policy automatically ages data out: keep raw points for a day, minute-rollups for a month, hour-rollups for a year, and delete anything older. You get to keep a long, useful history of trends for a tiny fraction of what storing every raw point would cost.
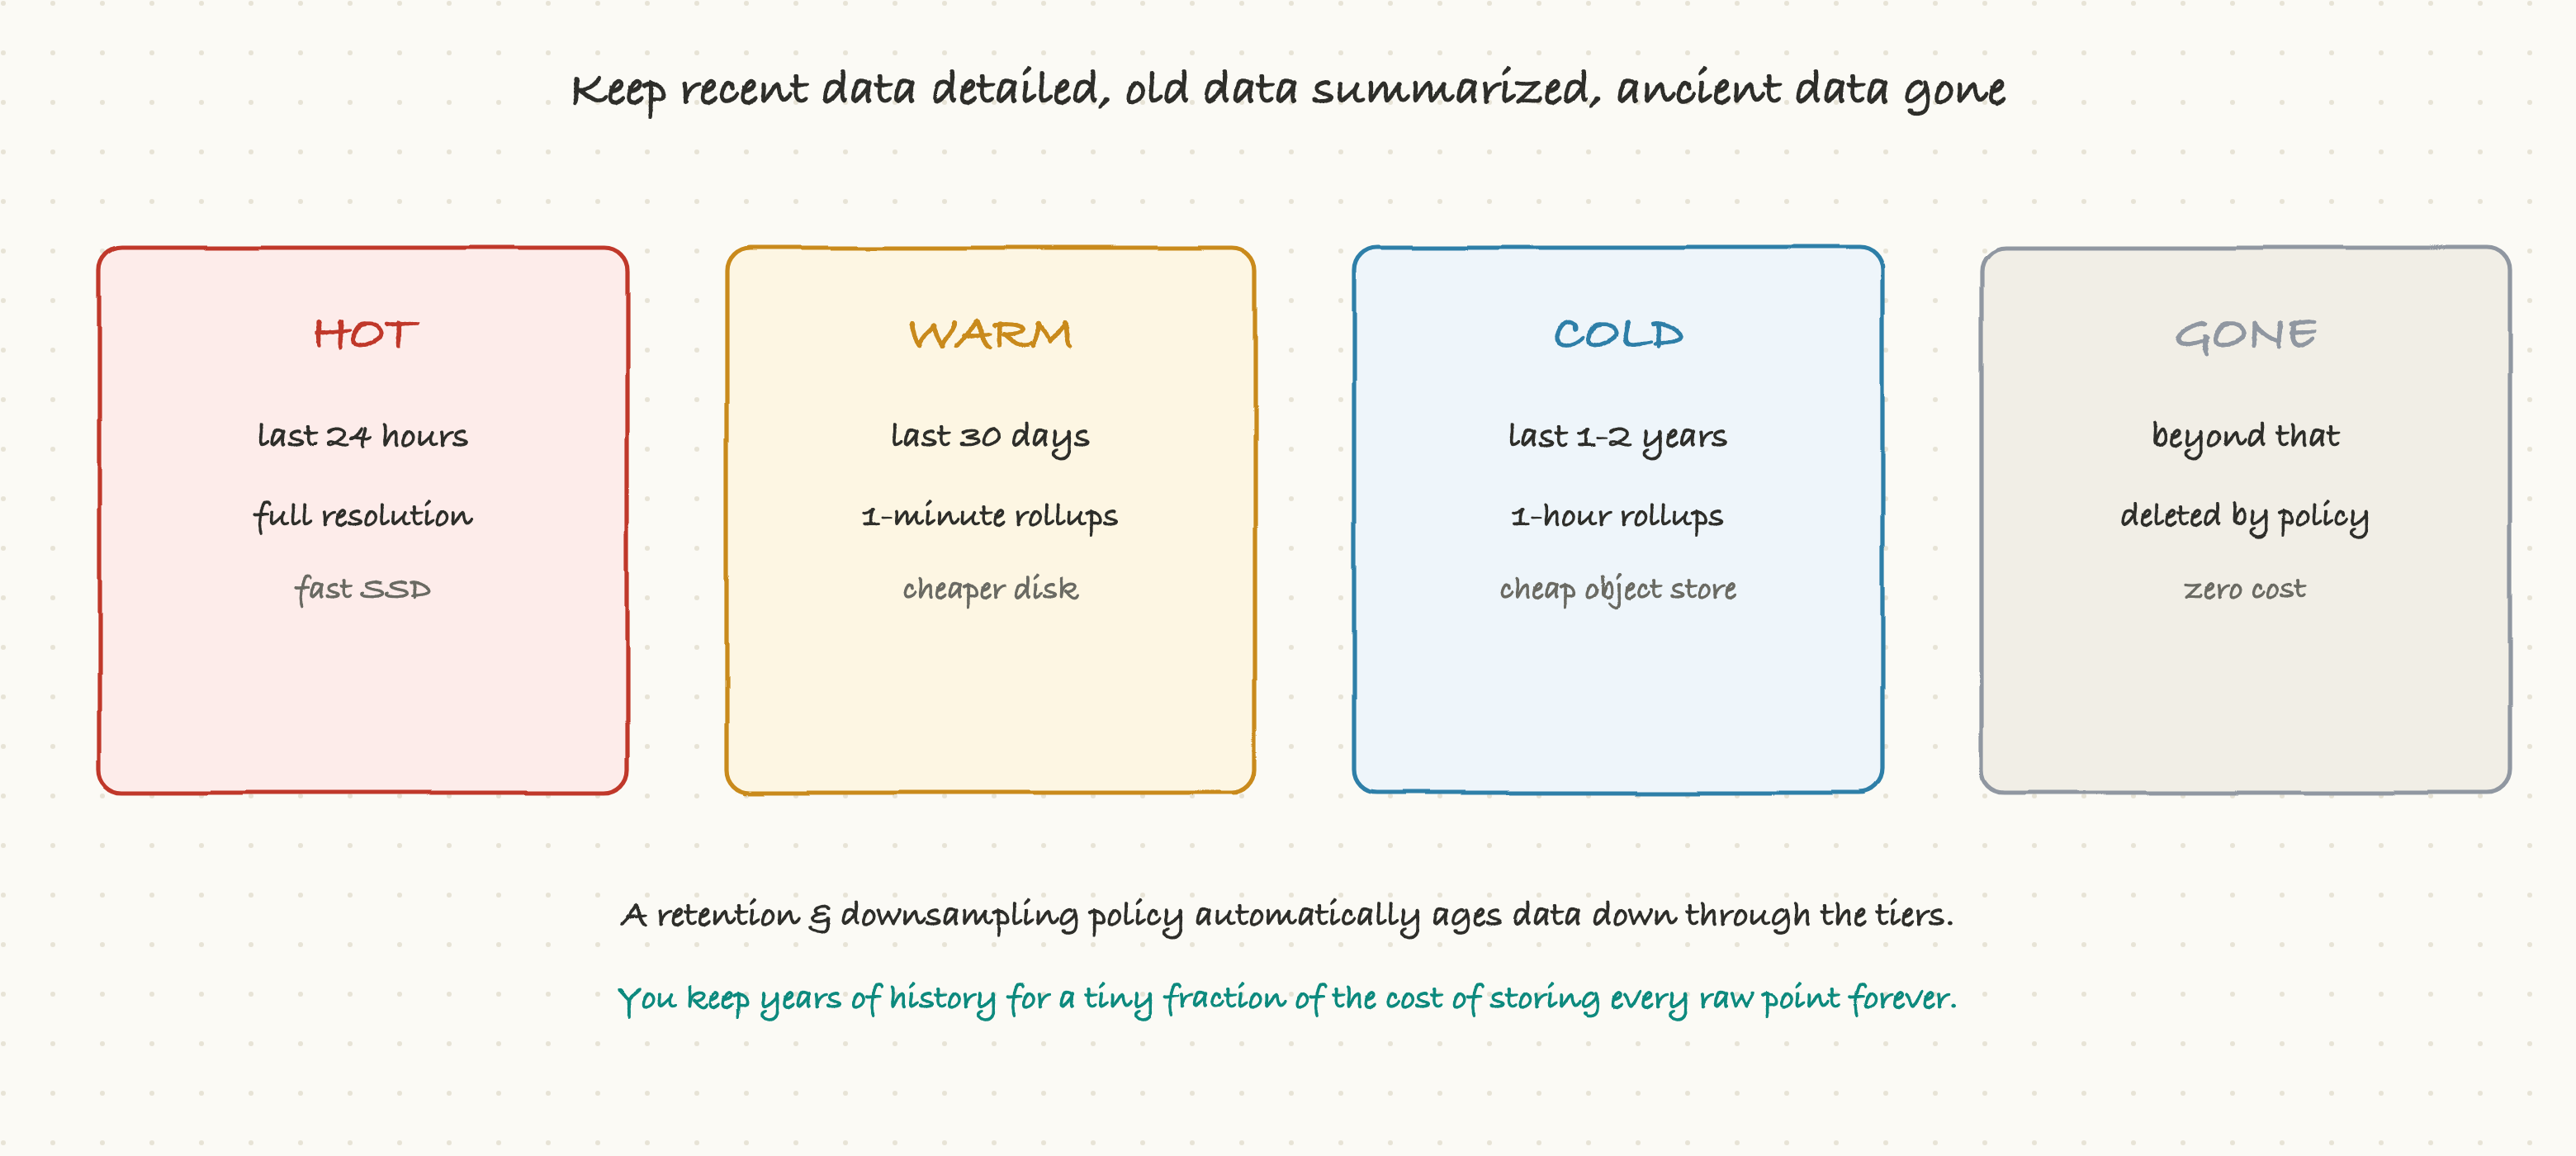
In practice this is organized into tiers: hot data (recent, full-resolution, on fast storage), warm data (older, downsampled, on cheaper storage), cold data (ancient, heavily summarized, on the cheapest storage), and finally deletion. The database moves data down through these tiers automatically based on your policy. This tiered, age-it-down approach is how a monitoring system can show you both this second's CPU spike and last year's seasonal trend without storing impossible amounts of data.
Querying: it's all about windows
Because the questions you ask of time-series data are about trends rather than individual points, the core query is the time-windowed aggregation.
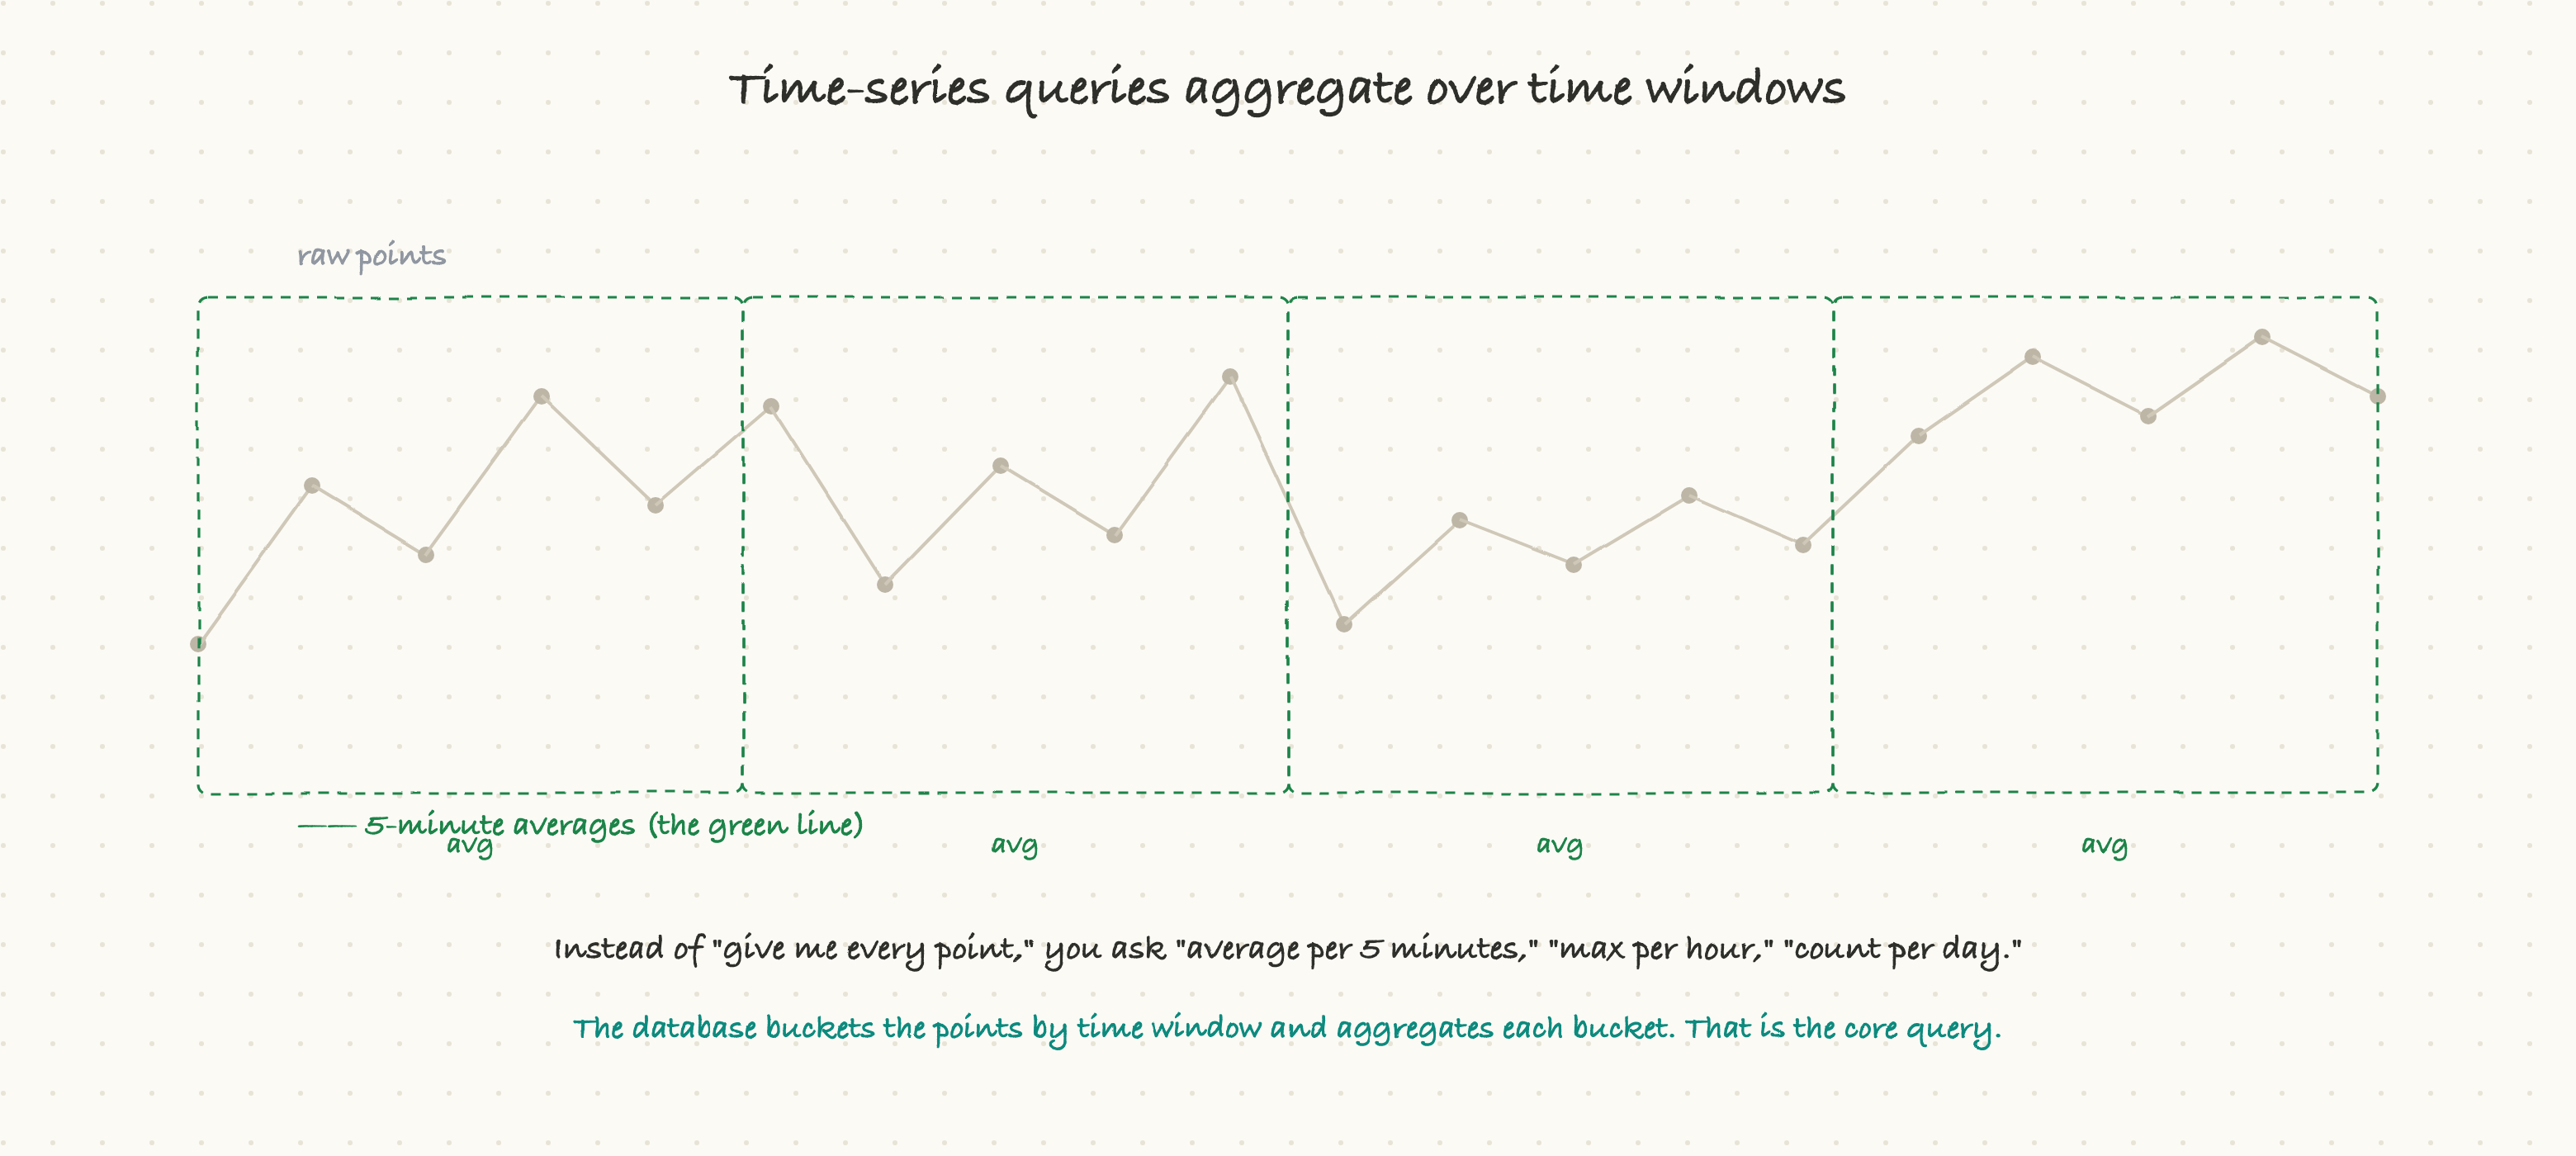
You rarely ask "give me every single point." You ask "what was the average CPU per 5-minute window over the last hour?" or "the maximum latency per minute today?" or "the count of errors per hour this week?" The database takes the raw points, groups them into time buckets, and computes an aggregate for each bucket, turning a jagged cloud of thousands of points into a clean, readable line. Every dashboard you've ever seen, every monitoring graph, is built on exactly this operation: bucket by time, aggregate each bucket. Time-series databases make this kind of query fast and natural, which is precisely what general databases do not.
When to use one, and when not
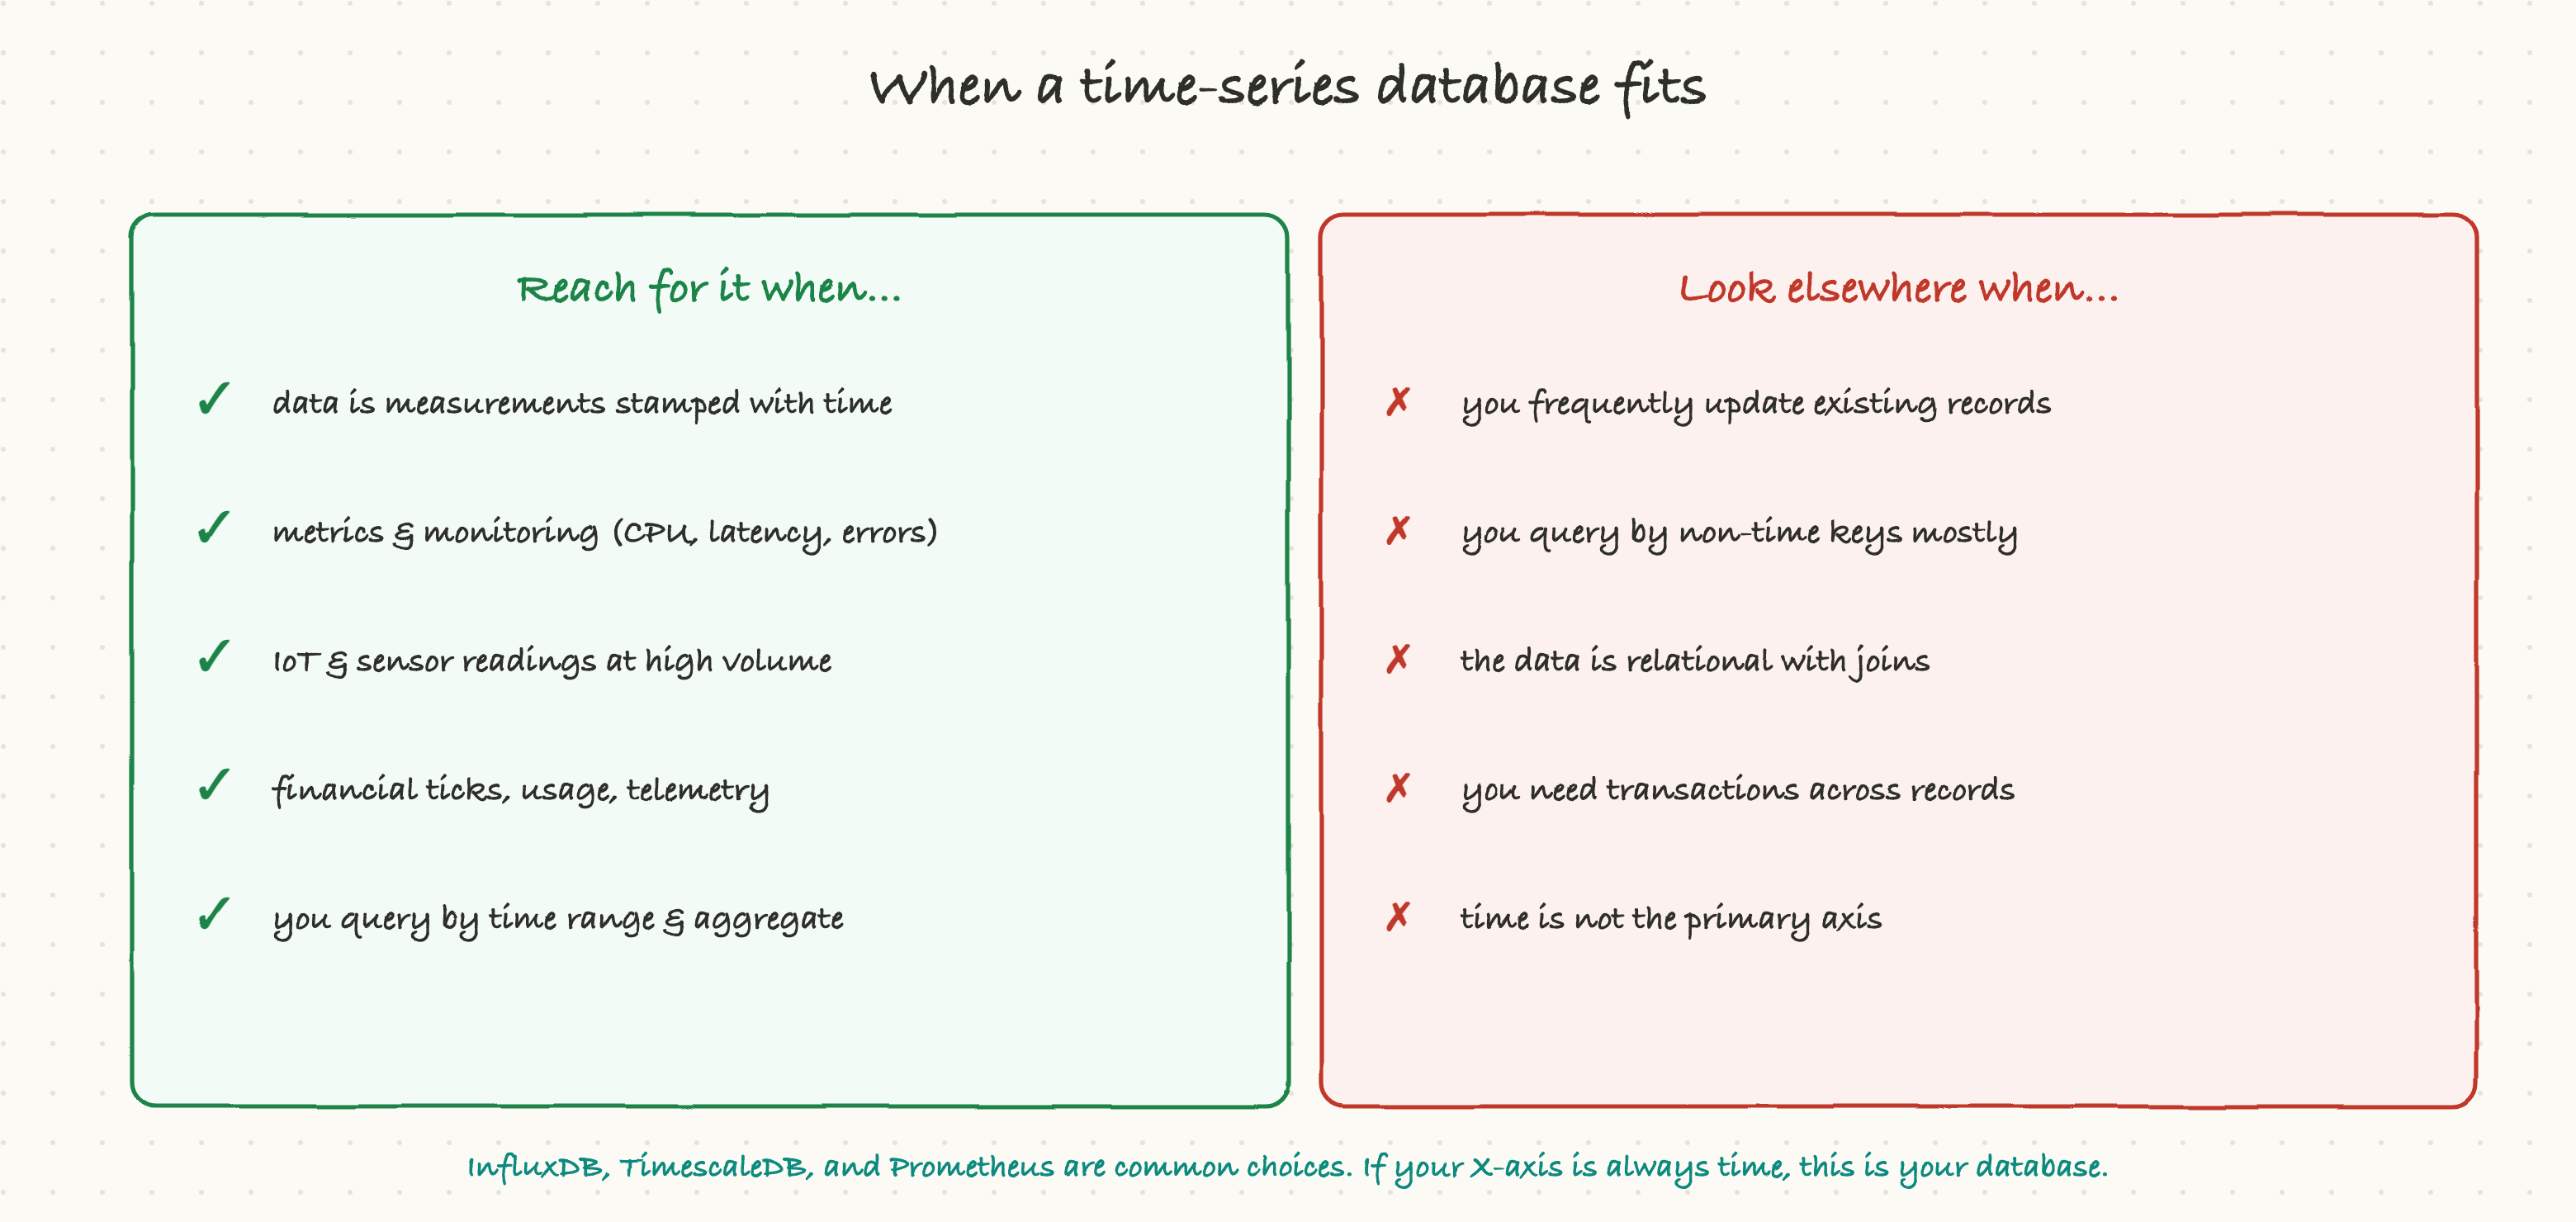
Reach for a time-series database when your data is measurements stamped with time and arriving in volume: server and application metrics, monitoring and observability, IoT and sensor readings, financial ticks, usage telemetry, anything where time is the primary axis and you query by ranges and aggregates. For these, a time-series database is dramatically more efficient than anything else.
Look elsewhere when you frequently update existing records (time-series is append-only by nature), when you mostly query by non-time keys, when your data is relational with lots of joins, or when time simply isn't the main organizing dimension. The test is simple: if the X-axis of your mental graph is almost always time, you're in time-series territory; if it's almost always something else, you're not.
Why a TPM should care
Time-series systems underpin a huge amount of operational visibility, and they come with their own economics and gotchas:
- This is the data behind your dashboards and alerts. The observability and monitoring that tell you whether your systems are healthy almost always run on a time-series database. When you think about reliability and on-call (as in the observability article), this is the data layer making it possible, and its health and retention settings directly affect what you can see during an incident.
- Retention is a real cost-and-capability tradeoff worth setting deliberately. How long you keep data, and at what resolution, is a policy decision that trades storage cost against how far back you can investigate. "Why can't we see what happened three months ago at full detail?" is usually a retention-policy choice, not a bug. It's worth setting that policy on purpose rather than by default.
- Cardinality is the silent killer. Time-series databases struggle when the number of unique tag combinations (called cardinality) explodes, for example, tagging every metric with a unique user ID. This is the most common way teams accidentally blow up a time-series system's cost and performance. If a team is adding high-cardinality tags, that's a fair thing to question early.
- Don't store metrics in your application database. If someone proposes recording high-volume metrics or sensor readings directly in the main relational database, that's a scaling trap, the volume and append pattern belong in a purpose-built time-series store. It's the same "right tool for the job" theme that runs through this whole series.
Time-series databases are a perfect illustration of the series' core lesson: a specific shape of data, append-only, time-stamped, queried by range, justifies a specialized tool that handles it far better than any general-purpose system could. As the world fills with more sensors, more services, and more monitoring, this quietly enormous category only grows. The final deep-dive turns to the newest member of the family, born from the AI revolution and built to store meaning itself: the vector database.